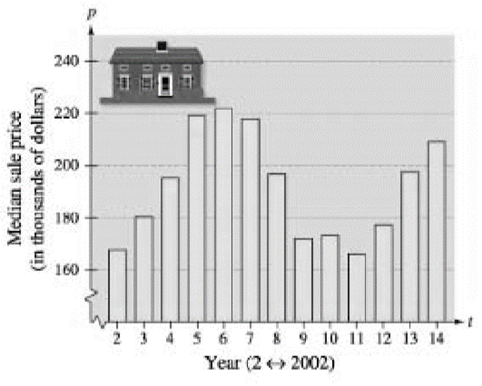
Median Sale Price The median sale price p (in thousands of dollars) of an existing one-family home in the United States from 2002 through 2014 (see figure) can be approximated by the model p ( t ) = { − 0.757 t 2 + 20.80 t + 127.2 , 2 ≤ t ≤ 6 3.879 t 2 − 82.50 t + 605.8 , 7 ≤ t ≤ 11 − 4.171 t 2 + 124.34 t − 714.2 , 12 ≤ t ≤ 14 where t represents the year, with t = 2 corresponding to 2002. Use this model to find the median sale price of an existing one-family home in each year from 2002 through 2014. ( Source: National Association of Realtors )
Median Sale Price The median sale price p (in thousands of dollars) of an existing one-family home in the United States from 2002 through 2014 (see figure) can be approximated by the model p ( t ) = { − 0.757 t 2 + 20.80 t + 127.2 , 2 ≤ t ≤ 6 3.879 t 2 − 82.50 t + 605.8 , 7 ≤ t ≤ 11 − 4.171 t 2 + 124.34 t − 714.2 , 12 ≤ t ≤ 14 where t represents the year, with t = 2 corresponding to 2002. Use this model to find the median sale price of an existing one-family home in each year from 2002 through 2014. ( Source: National Association of Realtors )
Solution Summary: The author explains the function f, which is a well-defined relation between two variables so that for each and every value of independent and dependent variables, there exists only one value.
Median Sale Price The median sale price p (in thousands of dollars) of an existing one-family home in the United States from 2002 through 2014 (see figure) can be approximated by the model
p
(
t
)
=
{
−
0.757
t
2
+
20.80
t
+
127.2
,
2
≤
t
≤
6
3.879
t
2
−
82.50
t
+
605.8
,
7
≤
t
≤
11
−
4.171
t
2
+
124.34
t
−
714.2
,
12
≤
t
≤
14
where t represents the year, with
t
=
2
corresponding to 2002. Use this model to find the median sale price of an existing one-family home in each year from 2002 through 2014. (Source: National Association of Realtors)
Can you answer this question and give step by step and why and how to get it. Can you write it (numerical method)
There are three options for investing $1150. The first earns 10% compounded annually, the second earns 10% compounded quarterly, and the third earns 10% compounded continuously. Find equations that model each investment growth and
use a graphing utility to graph each model in the same viewing window over a 20-year period. Use the graph to determine which investment yields the highest return after 20 years. What are the differences in earnings among the three
investment?
STEP 1: The formula for compound interest is
A =
nt
= P(1 + − − ) n²,
where n is the number of compoundings per year, t is the number of years, r is the interest rate, P is the principal, and A is the amount (balance) after t years. For continuous compounding, the formula reduces to
A = Pert
Find r and n for each model, and use these values to write A in terms of t for each case.
Annual Model
r=0.10
A = Y(t) = 1150 (1.10)*
n = 1
Quarterly Model
r = 0.10
n = 4
A = Q(t) = 1150(1.025) 4t
Continuous Model
r=0.10
A = C(t) =…
Use a graphing utility to find the point of intersection, if any, of the graphs of the functions. Round your result to three decimal places. (Enter NONE in any unused answer blanks.)
y = 100e0.01x
(x, y) =
y = 11,250
×
Need a deep-dive on the concept behind this application? Look no further. Learn more about this topic, calculus and related others by exploring similar questions and additional content below.
Hypothesis Testing using Confidence Interval Approach; Author: BUM2413 Applied Statistics UMP;https://www.youtube.com/watch?v=Hq1l3e9pLyY;License: Standard YouTube License, CC-BY
Hypothesis Testing - Difference of Two Means - Student's -Distribution & Normal Distribution; Author: The Organic Chemistry Tutor;https://www.youtube.com/watch?v=UcZwyzwWU7o;License: Standard Youtube License


 Algebra & Trigonometry with Analytic GeometryAlgebraISBN:9781133382119Author:SwokowskiPublisher:Cengage
 Big Ideas Math A Bridge To Success Algebra 1: Stu...AlgebraISBN:9781680331141Author:HOUGHTON MIFFLIN HARCOURTPublisher:Houghton Mifflin Harcourt
 College AlgebraAlgebraISBN:9781305115545Author:James Stewart, Lothar Redlin, Saleem WatsonPublisher:Cengage Learning
 Algebra and Trigonometry (MindTap Course List)AlgebraISBN:9781305071742Author:James Stewart, Lothar Redlin, Saleem WatsonPublisher:Cengage Learning
 College Algebra (MindTap Course List)AlgebraISBN:9781305652231Author:R. David Gustafson, Jeff HughesPublisher:Cengage Learning