
To determine: The number of workers employed in each region during the given period of time.
Concept Introduction
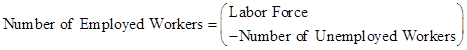
Labor Force: Labor force refers to the total number of workers in an economy which includes employed as well as unemployed workers.
Explanation of Solution
a. Number of employed workers in April 2013 and April 2014.
The formula to calculate the number of employed workers is as follows:
The below table shows the calculation of employed workers:
April 2013
| Region | Labor Force(Thousands)(A) | Unemployed Workers(Thousands)(B) | Employed Workers(Thousands) |
| Northeast | 28,407.2 | 2,174.4 | 26,232.8 |
| South | 56,787.8 | 4,089.9 | 52,697.9 |
| Midwest | 34,320.0 | 2,473.7 | 31,846.3 |
| West | 36,122.2 | 2,940.8 | 33,181.4 |
| Total | 143,958.4 |
April 2014
| Region | Labor Force(Thousands)(A) | Unemployed Workers(Thousands)(B) | Employed Workers(Thousands) |
| Northeast | 28,288.9 | 1,781.3 | 26,507.6 |
| South | 57,016.4 | 3,363.8 | 53,652.6 |
| Midwest | 34,467.0 | 2,109.0 | 32,358.0 |
| West | 36,307.3 | 2,535.7 | 33,771.6 |
| Total | 146,289.8 |
The change in the number of employed workers between April 2013 and April 2014 shall be calculated as follows:
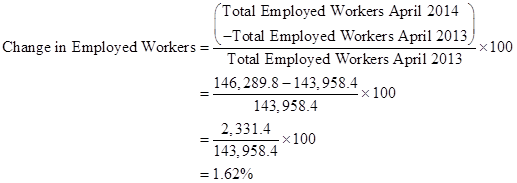
Conclusion:
Thus, there is an increase in number of employed workers between April 2013 and April 2014.
b. Growth in labor force.
The formula to calculate the growth in labor force between April 2013 and April 2014 is as follows:

The below table shows the calculation of growth in labor force in each region:
| Region | Labor Force in April 2013(Thousands)(A) | Labor Force in April 2014(Thousands)(B) | Growth in Labor Force(%)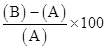 |
| Northeast | 28,407.2 | 28,288.9 |  |
| South | 56,787.8 | 57,016.4 | 0.41 |
| Midwest | 34,320.0 | 34,467.0 | 0.43 |
| West | 36,122.2 | 36,307.3 | 0.51 |
Conclusion:
Thus, there is a decrease in labor force in the Northeast and a growth in other regions.
c.
The formula to calculate the unemployment rate is as follows:
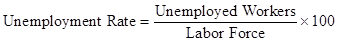
The below table shows the calculation of unemployment rate in each region:
April 2013
| Region | Labor Force(Thousands)(A) | Unemployed Workers(Thousands)(B) | Unemployment Rate(%) |
| Northeast | 28,407.2 | 2,174.4 | 7.65 |
| South | 56,787.8 | 4,089.9 | 7.20 |
| Midwest | 34,320.0 | 2,473.7 | 7.21 |
| West | 36,122.2 | 2,940.8 | 8.14 |
April 2014
| Region | Labor Force(Thousands)(A) | Unemployed Workers(Thousands)(B) | Unemployment Rate(%) |
| Northeast | 28,288.9 | 1,781.3 | 6.3 |
| South | 57,016.4 | 3,363.8 | 5.9 |
| Midwest | 34,467.0 | 2,109.0 | 6.12 |
| West | 36,307.3 | 2,535.7 | 6.98 |
Conclusion:
Thus, there is a decrease in unemployment rate in all the regions between April 2013 and April 2014.
d. Reason for fall in unemployment rate.
The unemployment rate has decreased in all the regions between April 2013 and April 2014.
The decrease in unemployment rate is shown in the table below:
| Region | Unemployment RateApril 2013(A)(%) | Unemployment RateApril 2014(B)(%) | Fall in Unemployment Rate(%) |
| Northeast | 7.65 | 6.3 | 1.35 |
| South | 7.20 | 5.9 | 1.3 |
| Midwest | 7.21 | 6.12 | 1.09 |
| West | 8.14 | 6.98 | 1.16 |
- It can be seen that in the regions of South, Midwest and West, the labor force has increased from April 2013 to April 2014.
- Hence, in these regions, the fall in unemployment rate is due to considerable net gain in the number of jobs.
- However, there is decrease in labor force in Northeast and still there is fall in unemployment rate due to the fall in number of people seeking jobs.
Conclusion:
Thus, there is a fall in unemployment rate.
Want to see more full solutions like this?

- 2. Suppose that a farmer has two ways to produce his crop. He can use a low-polluting technology with the marginal cost curve MCL or a high polluting technology with the marginal cost curve MCH. If the farmer uses the high-polluting technology, for each unit of quantity produced, one unit of pollution is also produced. Pollution causes pollution damages that are valued at $E per unit. The good produced can be sold in the market for $P per unit. P 1 MCH 0 Q₁ MCL Q2 E a. b. C. If there are no restrictions on the firm's choices, which technology will the farmer use and what quantity will he produce? Explain, referring to the area identified in the figure Given your response in part a, is it socially efficient for there to be no restriction on production? Explain, referring to the area identified in the figure If the government restricts production to Q1, what technology would the farmer choose? Would a socially efficient outcome be achieved? Explain, referring to the area identified in…arrow_forwardI need help in seeing how these are the answers. If you could please write down your steps so I can see how it's done please.arrow_forwardSuppose that a random sample of 216 twenty-year-old men is selected from a population and that their heights and weights are recorded. A regression of weight on height yields Weight = (-107.3628) + 4.2552 x Height, R2 = 0.875, SER = 11.0160 (2.3220) (0.3348) where Weight is measured in pounds and Height is measured in inches. A man has a late growth spurt and grows 1.6200 inches over the course of a year. Construct a confidence interval of 90% for the person's weight gain. The 90% confidence interval for the person's weight gain is ( ☐ ☐) (in pounds). (Round your responses to two decimal places.)arrow_forward
- Suppose that (Y, X) satisfy the assumptions specified here. A random sample of n = 498 is drawn and yields Ŷ= 6.47 + 5.66X, R2 = 0.83, SER = 5.3 (3.7) (3.4) Where the numbers in parentheses are the standard errors of the estimated coefficients B₁ = 6.47 and B₁ = 5.66 respectively. Suppose you wanted to test that B₁ is zero at the 5% level. That is, Ho: B₁ = 0 vs. H₁: B₁ #0 Report the t-statistic and p-value for this test. Definition The t-statistic is (Round your response to two decimal places) ☑ The Least Squares Assumptions Y=Bo+B₁X+u, i = 1,..., n, where 1. The error term u; has conditional mean zero given X;: E (u;|X;) = 0; 2. (Y;, X¡), i = 1,..., n, are independent and identically distributed (i.i.d.) draws from i their joint distribution; and 3. Large outliers are unlikely: X; and Y, have nonzero finite fourth moments.arrow_forwardAsap pleasearrow_forwardTasks Exercise 1 Assess the following functions: 1. f(x)= x2+6x+2 2.f '(x)=10x-2x2+5 a. Find the stationary points. (5 marks) b. Determine whether the stationary point is a maximum or minimum. (5 marks) c. Draw the corresponding curves (5 marks)arrow_forward
- Problem 2: The sales data over the last 10 years for the Acme Hardware Store are as follows: 2003 $230,000 2008 $526,000 2004 276,000 2009 605,000 2005 328,000 2010 690,000 2006 388,000 2011 779,000 2007 453,000 2012 873,000 1. Calculate the compound growth rate for the period of 2003 to 2012. 2. Based on your answer to part a, forecast sales for both 2013 and 2014. 3. Now calculate the compound growth rate for the period of 2007 to 2012. 1. Based on your answer to part e, forecast sales for both 2013 and 2014. 5. What is the major reason for the differences in your answers to parts b and d? If you were to make your own projections, what would you forecast? (Drawing a graph is very helpful.)arrow_forwardExercise 4A firm has the following average cost: AC = 200 + 2Q – 36 Q Find the stationary point and determine if it is a maximum or a minimum.b. Find the marginal cost function.arrow_forwardExercise 4A firm has the following average cost: AC = 200 + 2Q – 36 Q Find the stationary point and determine if it is a maximum or a minimum.b. Find the marginal cost function.arrow_forward
- Exercise 2A firm has the following short-run production function: Q = 30L2 -0.5L3a. Make a table with two columns: Production and Labour b. Add a third column to the table with the marginal product of labour c. Graph the values that you estimated for the production function and the marginal product oflabour Exercise 3A Firm has the following production function: Q= 20L-0.4L2a. Using differential calculus find the unit of labour that maximizes the production. b. Estimate function of Marginal product of labor c. Obtain the Average product of labor. d. Find the point at which the Marginal Product of Labour is equal to the Average Product of Labour.arrow_forwardProblem 3 You have the following data for the last 12 months' sales for the PRQ Corporation (in thousands of dollars): January 500 July 610 February 520 August 620 March 520 September 580 April 510 October 550 May 530 November 510 June 580 December 480 1. Calculate a 3-month centered moving average. 2. Use this moving average to forecast sales for January of next year. 3. If you were asked to forecast January and February sales for next year, would you be confident of your forecast using the preceding moving averages? Why or why not? expect? Explain.arrow_forwardProblem 5 The MNO Corporation is preparing for its stockholder meeting on May 15, 2013. It sent out proxies to its stockholders on March 15 and asked stockholders who plan to attend the meeting to respond. To plan for a sufficient number of information packages to be distributed at the meeting, as well as for refreshments to be served, the company has asked you to forecast the number of attending stockholders. By April 15, 378 stockholders have expressed their intention to attend. You have available the following data for the last 6 years for total attendance at the stockholder meeting and the number of positive responses as of April 15: Year Positive Responses Attendance 2007 322 520 2008 301 550 2009 398 570 2010 421 600 2011 357 570 2012 452 650 1. What is your attendance forecast for the 2013 stockholder meeting? 2. Are there any other factors that could affect attendance, and thus make your forecast inac- curate?arrow_forward

 Principles of Economics (12th Edition)EconomicsISBN:9780134078779Author:Karl E. Case, Ray C. Fair, Sharon E. OsterPublisher:PEARSON
 Engineering Economy (17th Edition)EconomicsISBN:9780134870069Author:William G. Sullivan, Elin M. Wicks, C. Patrick KoellingPublisher:PEARSON
 Principles of Economics (MindTap Course List)EconomicsISBN:9781305585126Author:N. Gregory MankiwPublisher:Cengage Learning
 Managerial Economics: A Problem Solving ApproachEconomicsISBN:9781337106665Author:Luke M. Froeb, Brian T. McCann, Michael R. Ward, Mike ShorPublisher:Cengage Learning
 Managerial Economics & Business Strategy (Mcgraw-...EconomicsISBN:9781259290619Author:Michael Baye, Jeff PrincePublisher:McGraw-Hill Education