Subpart (a):
Profit maximization.
Subpart (a):
Explanation of Solution
Table – 1 represents the value of quantity, total cost, and total revenue.
Table – 1
| Quantity | Total cost | Total revenue |
| 0 | 8 | 0 |
| 1 | 9 | 8 |
| 2 | 10 | 16 |
| 3 | 11 | 24 |
| 4 | 13 | 32 |
| 5 | 19 | 40 |
| 6 | 27 | 48 |
| 7 | 37 | 56 |
The profit can be calculated by using the following formula:
Substitute the respective value in equation (1) and calculate the profit.
The profit is –$8.
Table – 2 shows the value of the profit that is obtained, by using equation (1).
Table – 2
| Quantity | Total cost | Total revenue | Profit |
| 0 | 8 | 0 | –8 |
| 1 | 9 | 8 | –1 |
| 2 | 10 | 16 | 6 |
| 3 | 11 | 24 | 13 |
| 4 | 13 | 32 | 19 |
| 5 | 19 | 40 | 21 |
| 6 | 27 | 48 | 21 |
| 7 | 37 | 56 | 19 |
From the above table, the firm can maximize profit when they produce five or six units of output.
Concept introduction:
Perfect competitive firm:
Marginal Revenue (MR): Marginal revenue refers to the additional revenue earned due to increasing one more unit of output.
Marginal Cost (MC): The marginal cost refers to the amount of an additional cost incurred in the process of increasing one more unit of output.
Subpart (b):
Profit maximization.
Subpart (b):
Explanation of Solution
The marginal revenue can be calculated by using the following formula:
Substitute the respective value in equation (2) and calculate marginal revenue.
The marginal revenue is $8.
Table – 3 shows the value of the marginal revenue that obtained by using equation (2).
Table – 3
| Quantity | Total cost | Total revenue | Marginal revenue | Profit |
| 0 | 8 | 0 | – | –8 |
| 1 | 9 | 8 | 8 | –1 |
| 2 | 10 | 16 | 8 | 6 |
| 3 | 11 | 24 | 8 | 13 |
| 4 | 13 | 32 | 8 | 19 |
| 5 | 19 | 40 | 8 | 21 |
| 6 | 27 | 48 | 8 | 21 |
| 7 | 37 | 56 | 8 | 19 |
The marginal cost can be calculated by using the following formula:
Substitute the respective value in equation (3) and calculate the marginal cost.
The marginal cost is $8.
Table – 4 shows the value of the marginal cost that is obtained by using equation (3).
Table – 4
| Quantity | Total cost | Marginal cost | Total revenue | Marginal revenue | Profit |
| 0 | 8 | – | 0 | – | –8 |
| 1 | 9 | 1 | 8 | 8 | –1 |
| 2 | 10 | 1 | 16 | 8 | 6 |
| 3 | 11 | 1 | 24 | 8 | 13 |
| 4 | 13 | 2 | 32 | 8 | 19 |
| 5 | 19 | 6 | 40 | 8 | 21 |
| 6 | 27 | 8 | 48 | 8 | 21 |
| 7 | 37 | 10 | 56 | 8 | 19 |
Figure – 1 shows the marginal revenue curve and marginal cost curve.
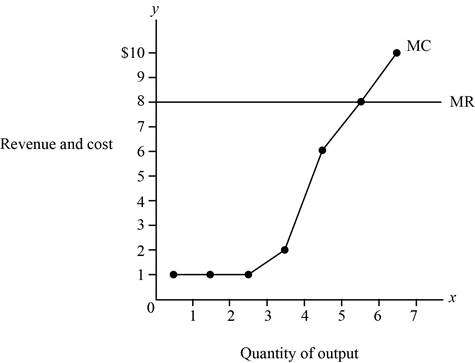
Figure – 1
From the above figure, the x axis shows the quantity of output and the y axis shows the price, that is, revenue and cost. From the above figure, the intersecting point shows the point the firm’s maximizing profit when they produce five or six units of output.
Concept introduction:
Perfect competitive firm: Perfect competition refers to the market structure featuring more number of sellers and buyers in the market, where the firm can sell homogenous products.
Marginal Revenue (MR): Marginal revenue refers to the additional revenue earned due to increasing one more unit of output.
Marginal Cost (MC): The marginal cost refers to the amount of an additional cost incurred in the process of increasing one more unit of output.
Subpart (c):
Profit in the long run.
Subpart (c):
Explanation of Solution
Since the marginal revenue is the same as each level of the quantity, the firm is in a competitive industry. The firm is earning an economic profit. Generally, firms in the long run earn a normal profit. Thus, the firm is not in the long run equilibrium.
Concept introduction:
Long run: Thelong run refers to the time, which changes the production variable to adjust to the market situation.
Want to see more full solutions like this?
Chapter 14 Solutions
Bundle: Principles of Microeconomics, 7th + Aplia, 1 term Printed Access Card

- Using the graph on the right, determine the per unit prices of capital and labour. 20- Given the information provided about the isocost lines, we know that the per unit price of capital is TC=$100 and the per unit price of labour is 16- TC $80 ○ A. $50; $20 ○ B. $2; $5 ○ C. $5; $2 ○ D. $20; $50 E. not determinable; not determinable Quantity of K 12 TC $60 TC $40 0 10 20 30 Quantity of L 40arrow_forwardThe diagram to the right contains isocost lines A and B. If the price of capital is the same for both lines, then the difference between isocost line A and isocost line B is that OA. the total cost is larger along B. B. the level of output is lower along A. C. both capital and labour are cheaper along A. OD. labour is more expensive along A. ○ E. labour is more expensive along B. Capital Labourarrow_forwardFor the firm whose cost curves are shown at right, the minimum efficient scale is ○ A. between 60 and 140 units of production. OB. about 20 units of production. OC. about 60 units of production. OD. about 100 units of production. OE. the level of fixed cost corresponding to SRATC2. SRATC₁ LRAC SRATC4 SRATC₂ SRATC3 เนด เad iso C 20 20 40 60 80 100 120 140 160 180 200 Output per Periodarrow_forward
- SRATC₂ SRATC3 In the figure, increasing long-run average total costs for the firm are confined to the output range OA. where the LRAC curve is downward sloping. B. above 80 units of output. O C. above 50 units of output. OD. between 50 and 80 units of output. SRATC₁ OE. between 10 and 100 units of output. ---- SRATC LRAC 10 20 30 40 50 60 70 80 90 100 Output per Periodarrow_forwardFor the firm whose cost curves are shown at right, the minimum efficient scale is OA. between 10 and 50 units of production. OB. about 80 units of production. O C. the level of fixed cost corresponding to SRATC₁. OD. about 10 units of production. ○ E. about 50 units of production. Cost per Unit SRATC₁ LRAC SRATC2 SRATC4 SRATC3 10 20 30 40 50 60 70 80 Output per Period 90 100arrow_forward• 3 different people working at any companies under the BPO industry in the Philippines. • What are the 3 different Vision, Mission, Duties and Responsibilities and Career Path of these people in their companies under the BPO industry?arrow_forward
- Module 6 ⚫(1902) Buckner C X | (1902) How to d x (1902) Buckner F X (1902) Productic X WP Videoplayer Canvas Login | Ir x | + Σ R mybrcc.instructure.com/courses/417310/discussion_topics/3420114?module_item_id=20155705 Spring 2025 Home Announcements Modules Syllabus Grades 8 People BRCC-_Library DLASC Module 6 Discussion - Business Costs Relaunch to update For this discussion, think about where you work or a business you have a significant amount of knowledge about. What is a common product that the business sells? What are the main costs the business has to incur in order to be able to sell that product? Which of these costs are fixed and which are variable? How much additional costs would be incurred if it were to sell one additional unit of that product (marginal cost)? Write a discussion thread about this business, the product it commonly sells, and your answers to the above questions. Also, respond to at least two threads created by your classmates. In these responses, share what…arrow_forwardRefer to the video to answer the following: • what are all the key policies or all the strategies the Philippine government should prioritize to accelerate sustainable economic growth? • these should consider the Philippines current economic challenges, including inflation, unemployment, and the need for digital transformation. "The Philippines' Strong Economic Growth" (YouTube link: https://youtu.be/1YtEoGp2ZeM?siJQfIv5kbu0txVsLL.)arrow_forwardsolve about this qarrow_forward
 Essentials of Economics (MindTap Course List)EconomicsISBN:9781337091992Author:N. Gregory MankiwPublisher:Cengage Learning
 Microeconomics: Principles & PolicyEconomicsISBN:9781337794992Author:William J. Baumol, Alan S. Blinder, John L. SolowPublisher:Cengage Learning

 Principles of Economics (MindTap Course List)EconomicsISBN:9781305585126Author:N. Gregory MankiwPublisher:Cengage Learning
 Principles of Economics, 7th Edition (MindTap Cou...EconomicsISBN:9781285165875Author:N. Gregory MankiwPublisher:Cengage Learning