Videos
To find:
• The
• The graph of the projectile at suitable x values.
• The graph of the height versus time.
• The range of the given projectile equations.
Answer to Problem 46E
Solution:
• The required range is
• The required graph is stated as follows.
• The required graph is stated as follows.
• The required apex is
Explanation of Solution
• The range of the given projectile equations.
The given equations are,
The formula to calculate the range is,
Here,
Let
Substitute
MATLAB Code:
t = 0:0.001:2;
v0 = 2;
g = 9.81;
theta = 30;
x = v0.*cosd(theta).*t;
y = v0.*sind(theta).*t -0.5.*g.*t.*t;
range = v0.^2.*sind(2*theta)/g
Save the MATLAB function with name chapter14_54793_14_46_1E.m in the current folder. Execute the function by typing the function name at the command window to generate output.
Result:
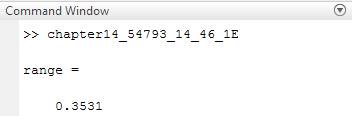
Therefore, the result is stated above.
• The graph of the projectile at suitable x values.
MATLAB Code:
t = 0:0.001:2;
v0 = 2;
g = 9.81;
theta = 30;
x = v0.*cosd(theta).*t;
y = v0.*sind(theta).*t -0.5.*g.*t.*t;
plot(t, x)
title('Position(x) vs Time(t)')
Save the MATLAB function with name chapter14_54793_14_46_2E.m in the current folder. Execute the function by typing the function name at the command window to generate output.
Result:
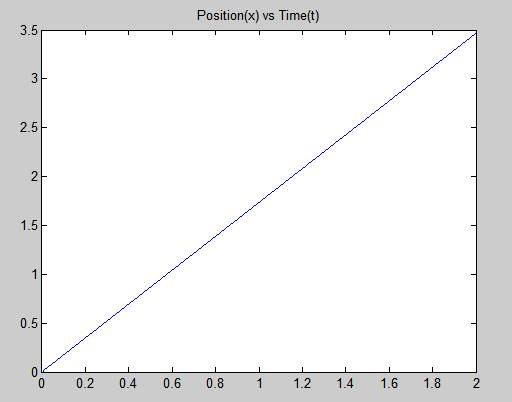
Therefore, the result is stated above.
• The graph of the height versus time.
MATLAB Code:
t = 0:0.001:2;
v0 = 2;
g = 9.81;
theta = 30;
x = v0.*cosd(theta).*t;
y = v0.*sind(theta).*t -0.5.*g.*t.*t;
plot(t, y)
title('Height(y) vs Time(t)')
Save the MATLAB function with name chapter14_54793_14_46_3E.m in the current folder. Execute the function by typing the function name at the command window to generate output.
Result:
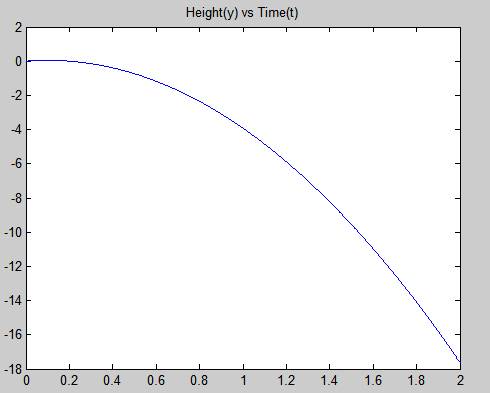
Therefore, the result is stated above.
• The range of the given projectile equations.
The given equations are,
The formula to calculate the maximum time,
Here,
Let
Substitute
MATLAB Code:
t = 0:0.001:2;
v0 = 2;
g = 9.81;
theta = 30;
x = v0.*cosd(theta).*t;
y = v0.*sind(theta).*t -0.5.*g.*t.*t;
apex_time = v0*sind(theta)/g;
fprintf('The apex is %.1f\n', apex_time)
Save the MATLAB function with name chapter14_54793_14_46_4E.m in the current folder. Execute the function by typing the function name at the command window to generate output.
Result:
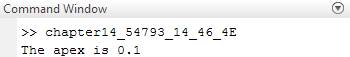
Therefore, the required apex is
Want to see more full solutions like this?
Chapter 14 Solutions
MATLAB: A Practical Introduction to Programming and Problem Solving


- Business Discussarrow_forwardThe following data represent total ventilation measured in liters of air per minute per square meter of body area for two independent (and randomly chosen) samples. Analyze these data using the appropriate non-parametric hypothesis testarrow_forwardeach column represents before & after measurements on the same individual. Analyze with the appropriate non-parametric hypothesis test for a paired design.arrow_forward
- Should you be confident in applying your regression equation to estimate the heart rate of a python at 35°C? Why or why not?arrow_forwardGiven your fitted regression line, what would be the residual for snake #5 (10 C)?arrow_forwardCalculate the 95% confidence interval around your estimate of r using Fisher’s z-transformation. In your final answer, make sure to back-transform to the original units.arrow_forward
 Algebra & Trigonometry with Analytic GeometryAlgebraISBN:9781133382119Author:SwokowskiPublisher:Cengage
 Trigonometry (MindTap Course List)TrigonometryISBN:9781305652224Author:Charles P. McKeague, Mark D. TurnerPublisher:Cengage Learning
 Trigonometry (MindTap Course List)TrigonometryISBN:9781337278461Author:Ron LarsonPublisher:Cengage Learning