Videos
Compare Current Cost to Historical Cost
Refer to the information in Exercise 14-36. In computing
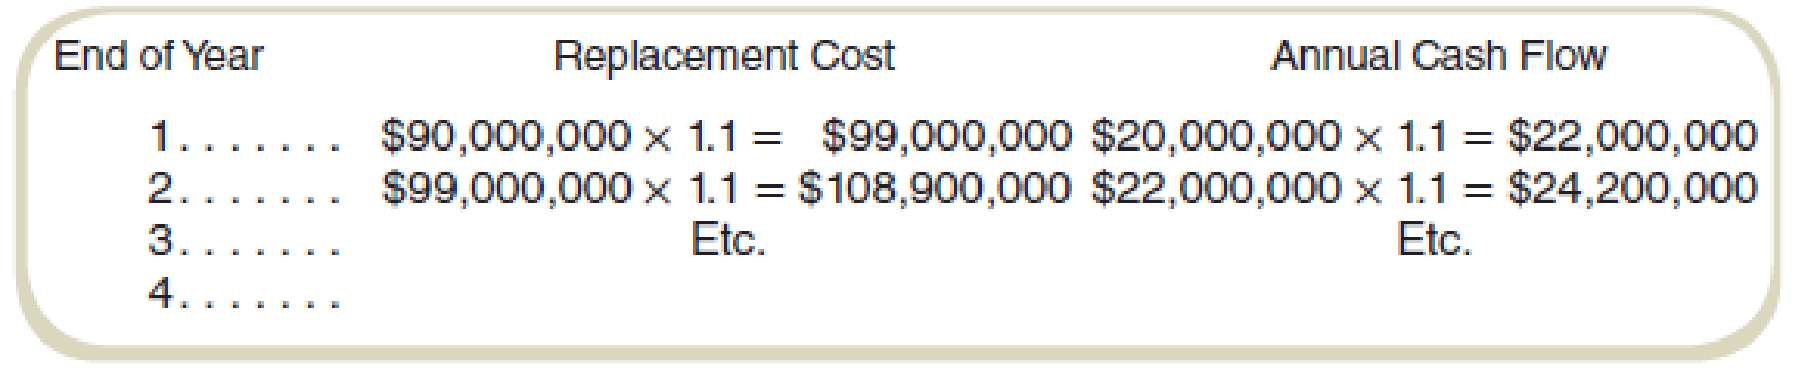
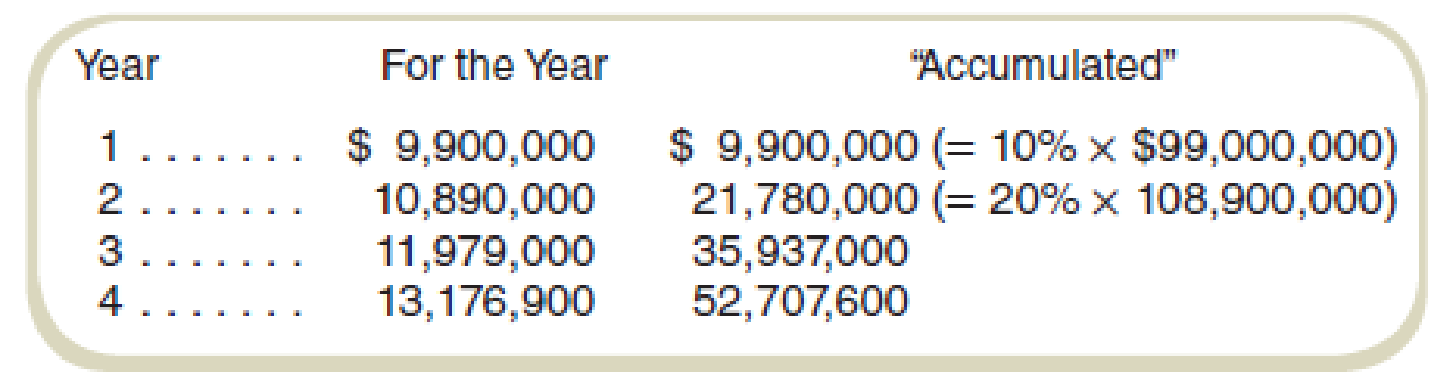
Note that “accumulated” depreciation is 10 percent of the gross book value of depreciable assets after one year, 20 percent after two years, and so forth.
Required
- a. Compute ROI using historical cost, net book value.
- b. Compute ROI using historical cost, gross book value.
- c. Compute ROI using current cost, net book value.
- d. Compute ROI using current cost, gross book value.
a.
Compute ROI by using historical cost, net book value.
Answer to Problem 38E
The ROI for year 1, year 2, year 3 and year 4 is 16.05%, 21.11%, 27.97%, and 37.56%.
Explanation of Solution
Net book value:
Net book value refers to the value of the asset after the adjustment of the depreciation. The value of the asset is calculated by deducting the cumulative depreciation from the book value of the asset.
Calculate the ROI using historical cost, net book value:
| Year |
Investment(3) (a) |
Operating profit (1) (b) |
ROI |
| 1 | $81,000,000 | $13,000,000 | 16.05% |
| 2 | $72,000,000 | $15,200,000 | 21.11% |
| 3 | $63,000,000 | $17,620,000 | 27.97% |
| 4 | $54,000,000 | $20,282,000 | 37.56% |
Table: (1)
Thus, the ROI for year 1, year 2, year 3 and year 4 is 16.05%, 21.11%, 27.97%, and 37.56%.
Working note 1:
Calculate the operating profit over the life of the asset:
| Year |
Gross cash flow (a) |
Net cash flow |
Depreciation (1) (c) |
Operating profit |
| 1 | $20,000,000 | $22,000,000 | $9,000,000 | $13,000,000 |
| 2 | $22,000,000 | $24,200,000 | $9,000,000 | $15,200,000 |
| 3 | $24,200,000 | $26,620,000 | $9,000,000 | $17,620,000 |
| 4 | $26,620,000 | $29,282,000 | $9,000,000 | $20,282,000 |
Table: (2)
Working note 2:
Calculate the depreciation:
Working note 3:
Calculate the investment base over the life of the asset:
| Year |
Gross asset value (a) |
Annual depreciation (b) |
Depreciation |
Net asset value |
| 1 | $90,000,000 | 10% | $9,000,000 | $81,000,000 |
| 2 | $90,000,000 | 20% | $18,000,000 | $72,000,000 |
| 3 | $90,000,000 | 30% | $27,000,000 | $63,000,000 |
| 4 | $90,000,000 | 40% | $36,000,000 | $54,000,000 |
Table: (3)
The depreciation has been calculated on the historical cost in this method.
b.
Compute ROI using historical cost, gross book value.
Answer to Problem 38E
The ROI for year 1, year 2, year 3 and year 4 is 14.44%, 16.89%, 19.58%, and 22.54%.
Explanation of Solution
Gross book value:
Gross book value is the value of the asset without the adjustment of the depreciation. The asset is recorded on the book value or the cost value.
Calculate the ROI using historical cost, net book value:
| Year |
Investment (a) |
Operating profit (1) (b) |
ROI |
| 1 | $90,000,000 | $13,000,000 | 14.44% |
| 2 | $90,000,000 | $15,200,000 | 16.89% |
| 3 | $90,000,000 | $17,620,000 | 19.58% |
| 4 | $90,000,000 | $20,282,000 | 22.54% |
Table: (4)
Thus, the ROI for year 1, year 2, year 3 and year 4 is 14.44%, 16.89%, 19.58%, and 22.54%.
c.
Compute ROI by using current cost, net book value.
Answer to Problem 38E
The ROI for year 1, year 2, year 3 and year 4 is 13.58%, 15.28%, 17.46%, and 20.37%.
Explanation of Solution
Current cost:
Current cost is the current market value of the asset. The depreciation is calculated on the current value of the asset rather than the historical cost of the asset.
Calculate the ROI using historical cost, net book value:
| Year |
Investment (7) (a) |
Operating profit (4) (b) |
ROI |
| 1 | $89,100,000 | $12,100,000 | 13.58% |
| 2 | $87,120,000 | $13,310,000 | 15.28% |
| 3 | $83,853,000 | $14,641,000 | 17.46% |
| 4 | $79,061,400 | $16,105,100 | 20.37% |
Table: (5)
Thus, the ROI for year 1, year 2, year 3 and year 4 is 13.58%, 15.28%, 17.46%, and 20.37%.
Working note 4:
Calculate the operating profit over the life of the asset:
| Year |
Gross cash flow (a) |
Net cash flow |
Depreciation (5) (c) |
Operating profit |
| 1 | $20,000,000 | $22,000,000 | $9,900,000 | $12,100,000 |
| 2 | $22,000,000 | $24,200,000 | $10,890,000 | $13,310,000 |
| 3 | $24,200,000 | $26,620,000 | $11,979,000 | $14,641,000 |
| 4 | $26,620,000 | $29,282,000 | $13,176,900 | $16,105,100 |
Table: (2)
Working note 5:
Calculate the depreciation over the life of the asset:
| Year |
Asset value (a) |
Annual Increment (b) |
The gross value of the asset |
Yearly depreciation |
Total depreciation |
| 1 | $36,000,000 | 10% | $39,600,000 | $9,900,000 | $9,900,000 |
| 2 | $39,600,000 | 10% | $43,560,000 | $10,890,000 | $21,780,000 |
| 3 | $43,560,000 | 10% | $47,916,000 | $11,979,000 | $35,937,000 |
| 4 | $47,916,000 | 10% | $52,707,600 | $13,176,900 | $52,707,600 |
Table: (6)
The closing gross value of each year will be the opening asset value of the next year.
Working note 6:
Calculate the asset value for the first year:
Working note 7:
Calculate the investment base over the life of the asset:
| Year |
Gross asset value (a) |
Depreciation (5) (b) |
Net asset value |
| 1 | $9,900,000 | $9,900,000 | $89,100,000 |
| 2 | $10,890,000 | $21,780,000 | $87,120,000 |
| 3 | $11,979,000 | $35,937,000 | $83,853,000 |
| 4 | $13,176,900 | $52,707,600 | $79,061,400 |
Table: (7)
d.
Compute ROI using current cost, gross book value.
Answer to Problem 38E
The ROI for year 1, year 2, year 3 and year 4 is 12.22% each year.
Explanation of Solution
Gross book value:
Gross book value is the value of the asset without the adjustment of the depreciation. The asset is recorded on the book value or the cost value.
Calculate the ROI using historical cost, net book value:
| Year |
Investment (a) |
Operating profit (4) (b) |
ROI |
| 1 | $99,000,000 | $12,100,000 | 12.22% |
| 2 | $108,900,000 | $13,310,000 | 12.22% |
| 3 | $119,790,000 | $14,641,000 | 12.22% |
| 4 | $131,769,000 | $16,105,100 | 12.22% |
Table: (8)
Thus, the ROI for year 1, year 2, year 3 and year 4 is 12.22% each year.
Want to see more full solutions like this?
Chapter 14 Solutions
GEN COMBO FUNDAMENTALS OF COST ACCOUNTING; CONNECT 1S ACCESS CARD


- Which account is a contra-asset?A. Accounts PayableB. Accumulated DepreciationC. Notes ReceivableD. Prepaid Rentneedarrow_forwardWhich account is a contra-asset?A. Accounts PayableB. Accumulated DepreciationC. Notes ReceivableD. Prepaid Rentarrow_forwardChoose the items of income or expense that belong in the described areas of Form 1120, Schedule M-1 (Sections: Income subject to tax not recorded on books, Expenses recorded on books this year not deducted on this return, Income recorded on books this year not included on this return, and Deductions on this return not charged against book income.) Note the appropriate amount for the item selected under each section. If the amount decreases taxable income relative to book income, provide the amount as a negative number. If the amount increases taxable income relative to book income, provide the amount as a positive number. The following adjusted revenue and expense accounts appeared in the accounting records of Pashi, Inc., an accrual basis taxpayer, for the year ended December 31, Year 2. Revenues Net sales $3,000,000 Interest 18,000 Gains on sales of stock 5,000 Key-man life insurance proceeds 100,000 Subtotal $3,123,000 Costs and Expenses Cost of…arrow_forward
 Cornerstones of Cost Management (Cornerstones Ser...AccountingISBN:9781305970663Author:Don R. Hansen, Maryanne M. MowenPublisher:Cengage Learning
 Managerial Accounting: The Cornerstone of Busines...AccountingISBN:9781337115773Author:Maryanne M. Mowen, Don R. Hansen, Dan L. HeitgerPublisher:Cengage Learning
 Principles of Accounting Volume 2AccountingISBN:9781947172609Author:OpenStaxPublisher:OpenStax College
 Survey of Accounting (Accounting I)AccountingISBN:9781305961883Author:Carl WarrenPublisher:Cengage Learning