
INTRODUCTORY STAT. W/MYLAB MATH>CUSTOM<
3rd Edition
ISBN: 9780135231548
Author: Gould
Publisher: PEARSON C
expand_more
expand_more
format_list_bulleted
Concept explainers
Videos
Textbook Question
Chapter 14, Problem 36SE
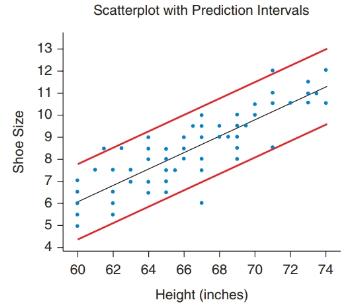
Shoes and Heights The
Expert Solution & Answer
Want to see the full answer?
Check out a sample textbook solution
Students have asked these similar questions
Show all work
Show all work
Show all work
Chapter 14 Solutions
INTRODUCTORY STAT. W/MYLAB MATH>CUSTOM<
Ch. 14 - Predicting Test Scores A professor tells his class...Ch. 14 - Used-Car Values A student wishes to buy a used...Ch. 14 - Height and Age (Example 1) A doctor says he can...Ch. 14 - Units and Semesters The registrar at a small...Ch. 14 - Prob. 5SECh. 14 - Prob. 6SECh. 14 - Prob. 7SECh. 14 - Prob. 8SECh. 14 - Semesters and Credits (Example 4) Figure A shows a...Ch. 14 - Prob. 10SE
Ch. 14 - Salaries Figure A shows a scatterplot of the...Ch. 14 - Prob. 12SECh. 14 - Wages of Twins Figure A shows a scatterplot of...Ch. 14 - Simulated Data Figure A shows a scatterplot of...Ch. 14 - Prob. 15SECh. 14 - Movie Budgets Do movies with bigger budgets tend...Ch. 14 - Education of Parents (Example 7) Each of 29...Ch. 14 - Education of Parents Refer to exercise 14.17 and...Ch. 14 - Student and Parent Heights A random sample of 29...Ch. 14 - Trash The weight of trash (in pounds) produced by...Ch. 14 - Prob. 21SECh. 14 - Prob. 22SECh. 14 - Trash and Confidence Intervals The output provided...Ch. 14 - Movie Budgets In exercise 14.16 you examined the...Ch. 14 - Predicted GPA A student who has been accepted by...Ch. 14 - Used BMWs A used-car dealer is purchasing 50 used...Ch. 14 - Predicted Height (Example 9) A mother wants to...Ch. 14 - Predicted GPA A dean of students at a college...Ch. 14 - Loggers A logging company has the diameter of each...Ch. 14 - Prob. 30SECh. 14 - House Prices (Example 10) Figure A contains the...Ch. 14 - Math SAT Score and GPA Figure A shows information...Ch. 14 - Height and Weight A scatterplot of the heights and...Ch. 14 - Waist Size and Weight A scatterplot of the waist...Ch. 14 - GPA and SAT The figure shows 95#37; prediction...Ch. 14 - Shoes and Heights The scatterplot shows shoe size...Ch. 14 - Height and Weight A scatterplot of the heights and...Ch. 14 - Waist Size and Weight A scatterplot of the waist...Ch. 14 - Baseball Players Figure A shows a scatterplot with...Ch. 14 - Predicting Education Figure A shows a scatterplot...Ch. 14 - Life Expectancy and Gestation Periods for Animals...Ch. 14 - Prob. 42CRE
Additional Math Textbook Solutions
Find more solutions based on key concepts
Provide an example of a qualitative variable and an example of a quantitative variable.
Elementary Statistics ( 3rd International Edition ) Isbn:9781260092561
Find all solutions of each equation in the interval .
Precalculus: A Unit Circle Approach (3rd Edition)
First Derivative Test a. Locale the critical points of f. b. Use the First Derivative Test to locale the local ...
Calculus: Early Transcendentals (2nd Edition)
Let F be a continuous distribution function. If U is uniformly distributed on (0,1), find the distribution func...
A First Course in Probability (10th Edition)
1. How is a sample related to a population?
Elementary Statistics: Picturing the World (7th Edition)
Check Your Understanding
Reading Check Complete each sentence using > or < for □.
RC1. 3 dm □ 3 dam
Basic College Mathematics
Knowledge Booster


Learn more about
Need a deep-dive on the concept behind this application? Look no further. Learn more about this topic, statistics and related others by exploring similar questions and additional content below.Similar questions
- Show all workarrow_forwardplease find the answers for the yellows boxes using the information and the picture belowarrow_forwardA marketing agency wants to determine whether different advertising platforms generate significantly different levels of customer engagement. The agency measures the average number of daily clicks on ads for three platforms: Social Media, Search Engines, and Email Campaigns. The agency collects data on daily clicks for each platform over a 10-day period and wants to test whether there is a statistically significant difference in the mean number of daily clicks among these platforms. Conduct ANOVA test. You can provide your answer by inserting a text box and the answer must include: also please provide a step by on getting the answers in excel Null hypothesis, Alternative hypothesis, Show answer (output table/summary table), and Conclusion based on the P value.arrow_forward
- A company found that the daily sales revenue of its flagship product follows a normal distribution with a mean of $4500 and a standard deviation of $450. The company defines a "high-sales day" that is, any day with sales exceeding $4800. please provide a step by step on how to get the answers Q: What percentage of days can the company expect to have "high-sales days" or sales greater than $4800? Q: What is the sales revenue threshold for the bottom 10% of days? (please note that 10% refers to the probability/area under bell curve towards the lower tail of bell curve) Provide answers in the yellow cellsarrow_forwardBusiness Discussarrow_forwardThe following data represent total ventilation measured in liters of air per minute per square meter of body area for two independent (and randomly chosen) samples. Analyze these data using the appropriate non-parametric hypothesis testarrow_forward
- each column represents before & after measurements on the same individual. Analyze with the appropriate non-parametric hypothesis test for a paired design.arrow_forwardShould you be confident in applying your regression equation to estimate the heart rate of a python at 35°C? Why or why not?arrow_forwardGiven your fitted regression line, what would be the residual for snake #5 (10 C)?arrow_forward
arrow_back_ios
SEE MORE QUESTIONS
arrow_forward_ios
Recommended textbooks for you
 Holt Mcdougal Larson Pre-algebra: Student Edition...AlgebraISBN:9780547587776Author:HOLT MCDOUGALPublisher:HOLT MCDOUGAL
 Glencoe Algebra 1, Student Edition, 9780079039897...AlgebraISBN:9780079039897Author:CarterPublisher:McGraw Hill
 Big Ideas Math A Bridge To Success Algebra 1: Stu...AlgebraISBN:9781680331141Author:HOUGHTON MIFFLIN HARCOURTPublisher:Houghton Mifflin Harcourt
Holt Mcdougal Larson Pre-algebra: Student Edition...
Algebra
ISBN:9780547587776
Author:HOLT MCDOUGAL
Publisher:HOLT MCDOUGAL
Glencoe Algebra 1, Student Edition, 9780079039897...
Algebra
ISBN:9780079039897
Author:Carter
Publisher:McGraw Hill
Big Ideas Math A Bridge To Success Algebra 1: Stu...
Algebra
ISBN:9781680331141
Author:HOUGHTON MIFFLIN HARCOURT
Publisher:Houghton Mifflin Harcourt
The Shape of Data: Distributions: Crash Course Statistics #7; Author: CrashCourse;https://www.youtube.com/watch?v=bPFNxD3Yg6U;License: Standard YouTube License, CC-BY
Shape, Center, and Spread - Module 20.2 (Part 1); Author: Mrmathblog;https://www.youtube.com/watch?v=COaid7O_Gag;License: Standard YouTube License, CC-BY
Shape, Center and Spread; Author: Emily Murdock;https://www.youtube.com/watch?v=_YyW0DSCzpM;License: Standard Youtube License