
Videos
House Prices (Example 10) Figure A contains the selling price and area (in square feet) of 81 recently sold homes in a region where a buyer wants to purchase a home.
a. Use the equation to estimate the price of a home with 2500 square feet.
b. The buyer wants to know the uncertainty in the prices he might pay for a home with 2500 square feet in this region. Should he use a prediction interval or a confidence interval? Explain.
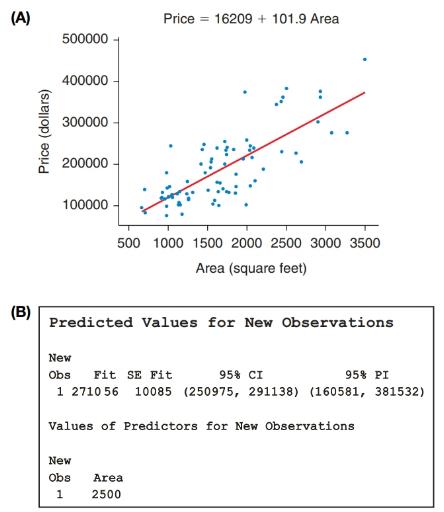
c. Report the correct 95% interval, confidence or prediction as determined in part b, for the predicted price. See Figure B.
d. The buyer has prequalified for a loan up to
Want to see the full answer?
Check out a sample textbook solution
Chapter 14 Solutions
EP INTRODUCTORY STATISTICS-MYSTATLAB
Additional Math Textbook Solutions
Elementary Statistics: Picturing the World (7th Edition)
College Algebra (7th Edition)
Precalculus: Mathematics for Calculus (Standalone Book)
Precalculus: A Unit Circle Approach (3rd Edition)
Elementary Statistics ( 3rd International Edition ) Isbn:9781260092561
Thinking Mathematically (6th Edition)


- A company found that the daily sales revenue of its flagship product follows a normal distribution with a mean of $4500 and a standard deviation of $450. The company defines a "high-sales day" that is, any day with sales exceeding $4800. please provide a step by step on how to get the answers in excel Q: What percentage of days can the company expect to have "high-sales days" or sales greater than $4800? Q: What is the sales revenue threshold for the bottom 10% of days? (please note that 10% refers to the probability/area under bell curve towards the lower tail of bell curve) Provide answers in the yellow cellsarrow_forwardFind the critical value for a left-tailed test using the F distribution with a 0.025, degrees of freedom in the numerator=12, and degrees of freedom in the denominator = 50. A portion of the table of critical values of the F-distribution is provided. Click the icon to view the partial table of critical values of the F-distribution. What is the critical value? (Round to two decimal places as needed.)arrow_forwardA retail store manager claims that the average daily sales of the store are $1,500. You aim to test whether the actual average daily sales differ significantly from this claimed value. You can provide your answer by inserting a text box and the answer must include: Null hypothesis, Alternative hypothesis, Show answer (output table/summary table), and Conclusion based on the P value. Showing the calculation is a must. If calculation is missing,so please provide a step by step on the answers Numerical answers in the yellow cellsarrow_forward
 Glencoe Algebra 1, Student Edition, 9780079039897...AlgebraISBN:9780079039897Author:CarterPublisher:McGraw Hill
 Holt Mcdougal Larson Pre-algebra: Student Edition...AlgebraISBN:9780547587776Author:HOLT MCDOUGALPublisher:HOLT MCDOUGAL
 Big Ideas Math A Bridge To Success Algebra 1: Stu...AlgebraISBN:9781680331141Author:HOUGHTON MIFFLIN HARCOURTPublisher:Houghton Mifflin Harcourt