
Videos
a.
Draw a dot plot using the 15 observations on number of violent crimes reported.
Find the schools that stand out from the rest.
a.
Answer to Problem 26E
The dot plot using the 15 observations on number of violent crimes reported is given below:
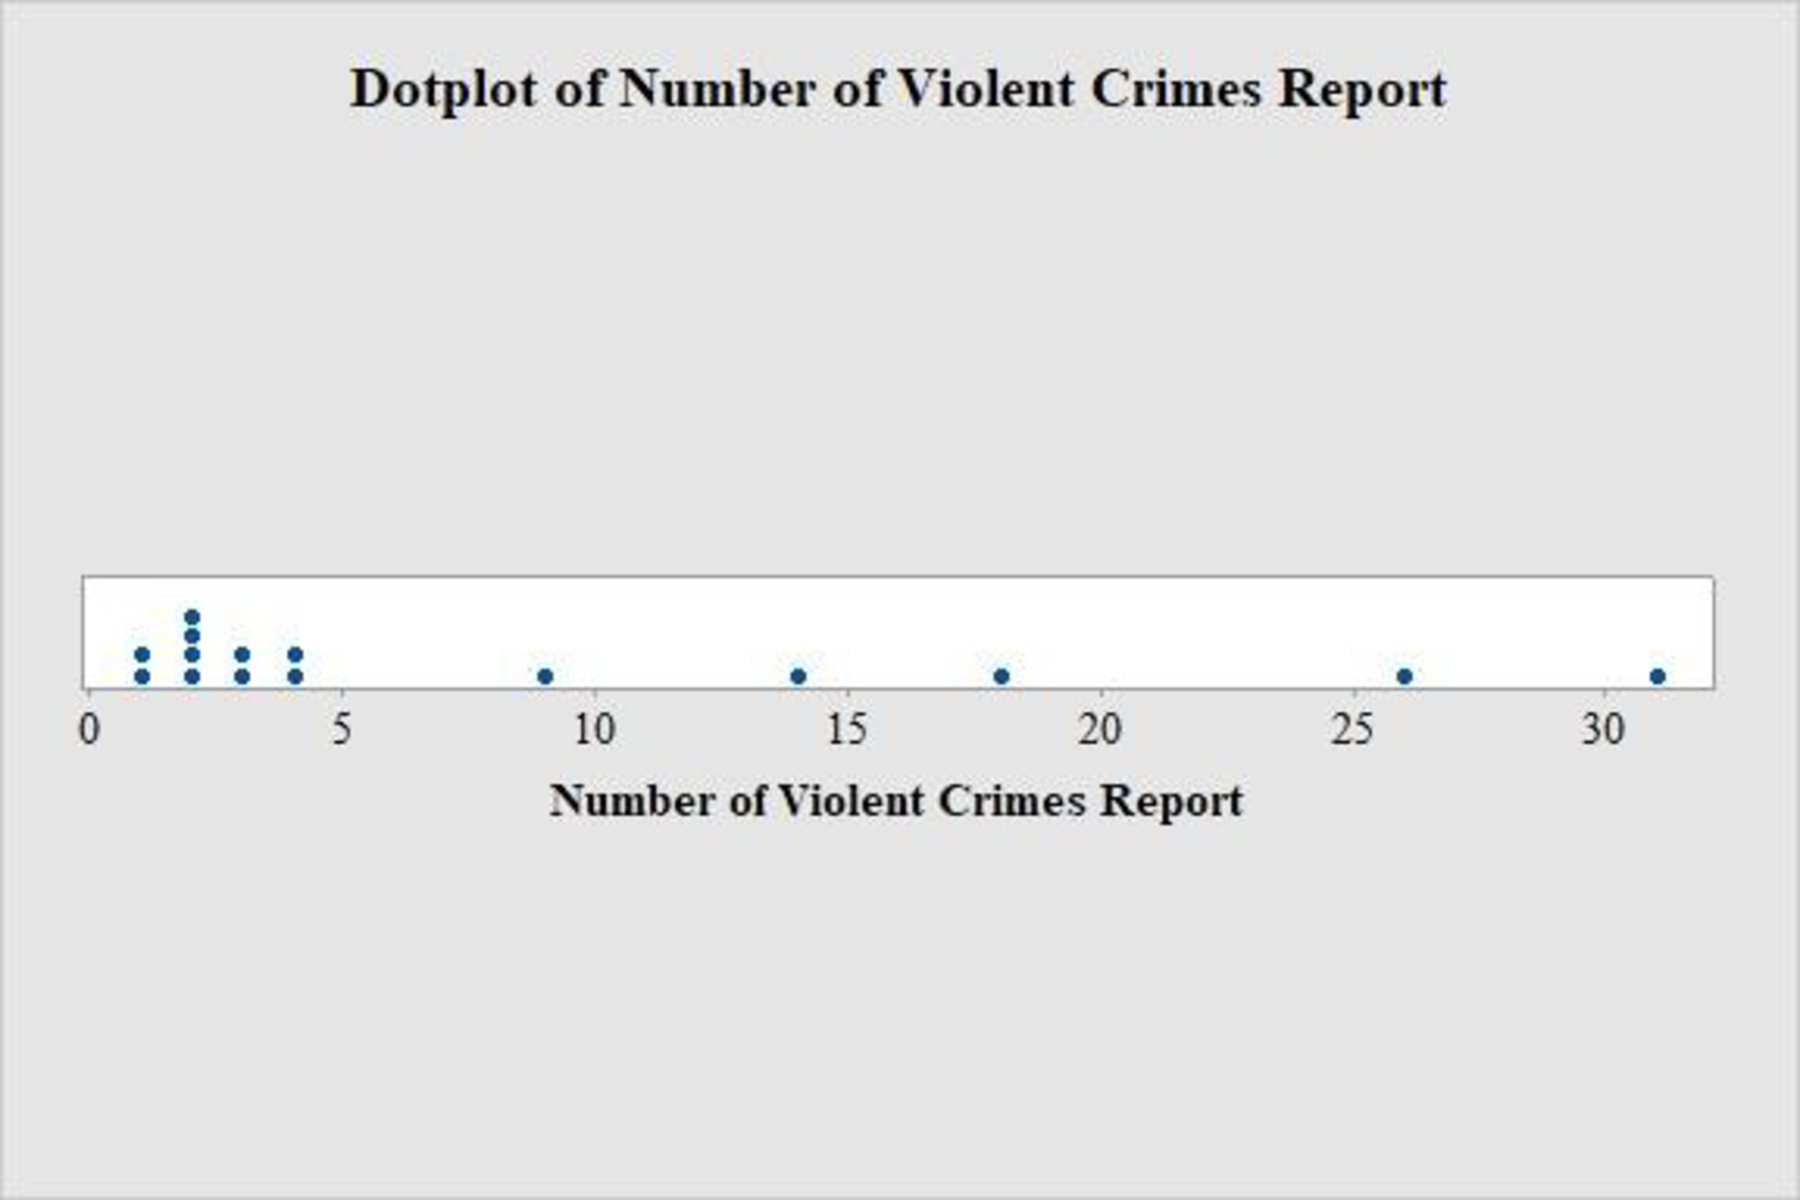
University of Florida, University of Central Florida and Florida State University are stand out from the rest.
Explanation of Solution
Calculation:
The data represents the number of violent crimes reported in 2012 on public college campuses in State F.
Software procedure:
Step-by-step procedure to obtain dot-plot using MINITAB software:
- Choose Graph > Dot plot.
- Choose One Y, select simple and then click OK.
- In Graph variables, enter the column of Number of Violent Crimes Report.
- Click OK.
Observation:
From the dot plot, it can be observed that three schools stand out from the rest, since higher number of crimes is reported in these schools compared to the rest.
Thus, the schools University of Florida, University of Central Florida and Florida State University are stand out from the rest.
b.
Find the violent crime rate for the other 14 schools and then draw a dot plot using these values.
Check whether the same schools stand out as unusual in this plot.
b.
Answer to Problem 26E
The violent crime rates for the other 14 schools are as follows:
| University/College | Violent Crime Rate Per 1,000 Students |
| Edison State College | 0.2338 |
| Florida A&M University | 1.0603 |
| Florida Atlantic University | 0.1584 |
| Florida Gulf Coast University | 0.2334 |
| Florida International University | 0.2017 |
| Florida State University | 0.7549 |
| New College of Florida | 1.18341 |
| Pensacola State College | 0.2602 |
| Santa Fe College | 0.0645 |
| Tallahassee Community College | 0.1325 |
| University of Central Florida | 0.4447 |
| University of Florida | 0.3630 |
| University of North Florida | 0.1235 |
| University of South Florida | 0.4640 |
| University of West Florida | 0.1669 |
The dot plot using the 15 observations on violent crime rate is given below:
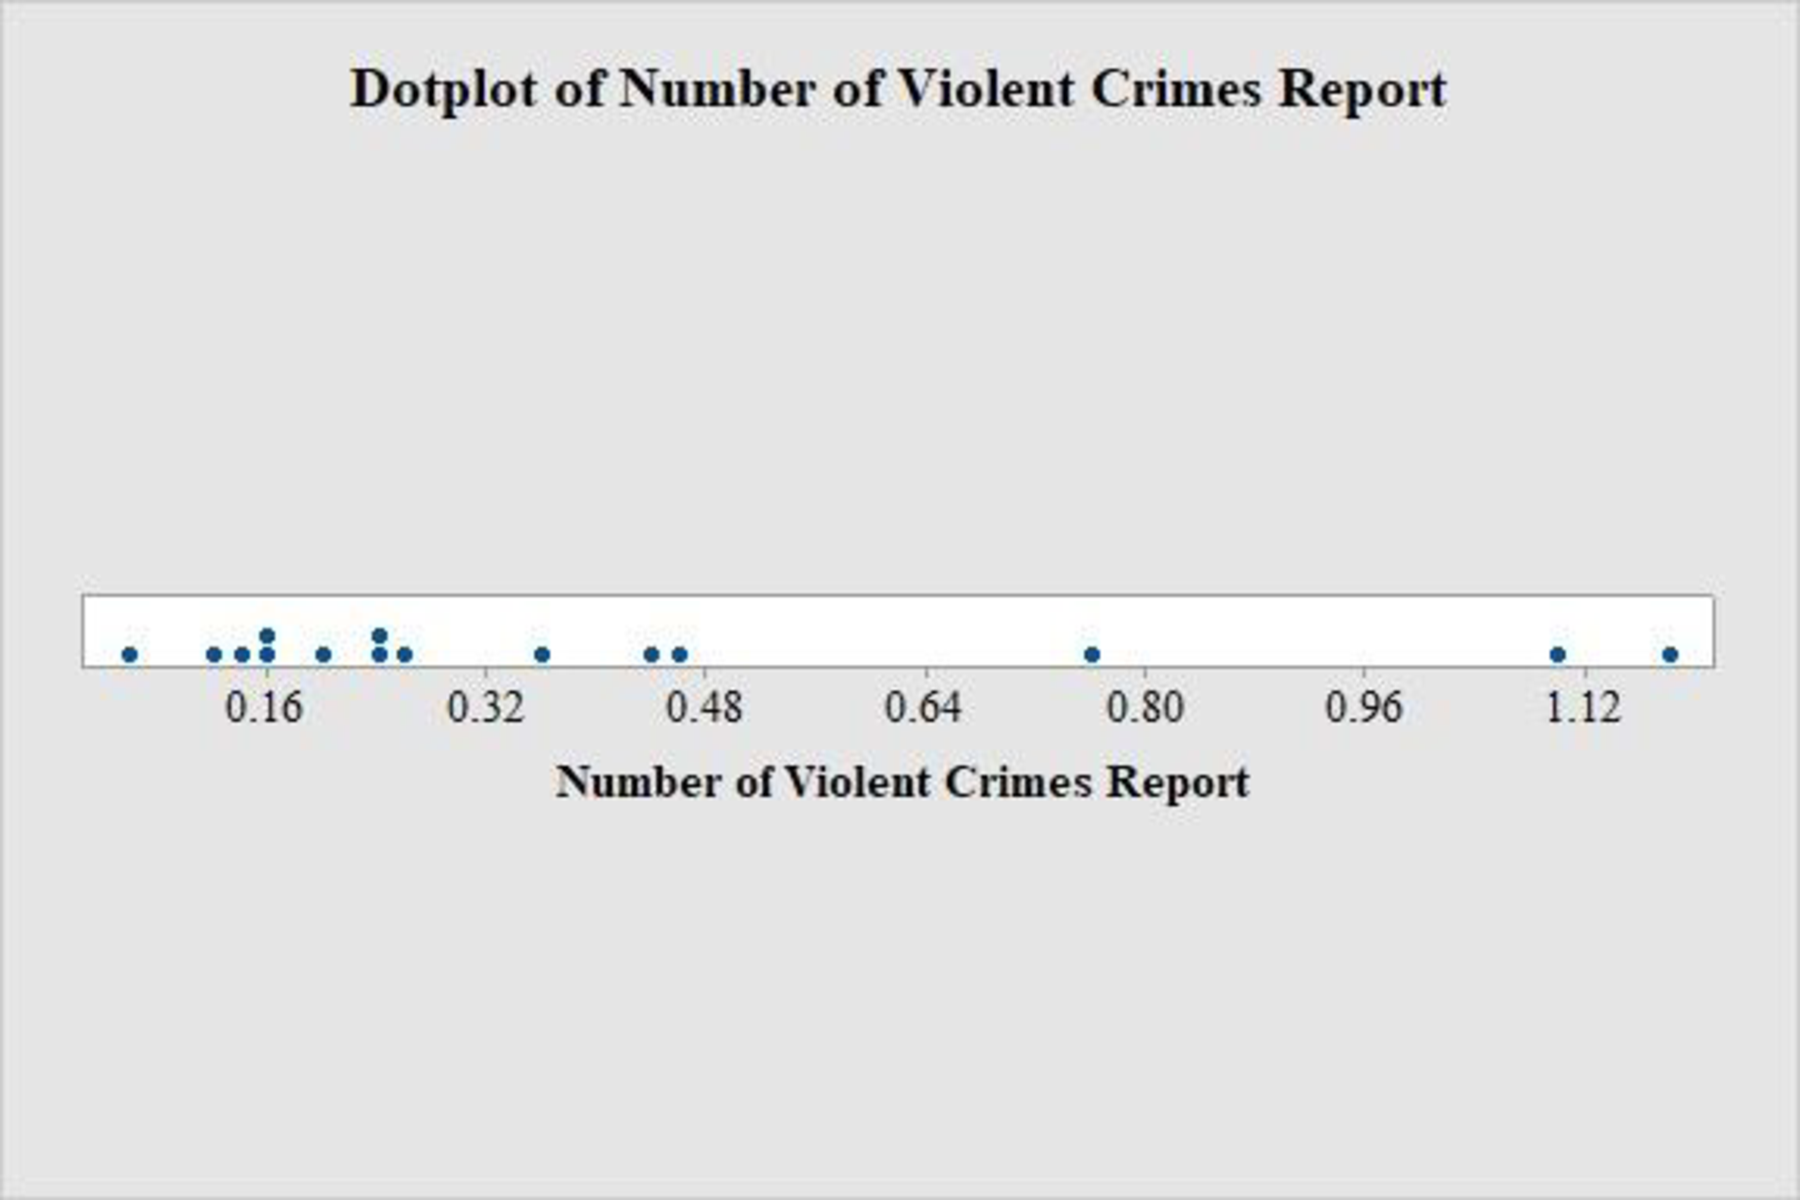
The schools stand out as unusual are not same.
Explanation of Solution
It is given that the violent crime rate for Florida A&M University is calculated as follows:
Then the violent crime rates for the other 14 schools are obtained as follows:
| University/College | Violent Crime Rate Per 1,000 Students |
| Edison State College | |
| Florida A&M University | |
| Florida Atlantic University | |
| Florida Gulf Coast University | |
| Florida International University | |
| Florida State University | |
| New College of Florida | |
| Pensacola State College | |
| Santa Fe College | |
| Tallahassee Community College | |
| University of Central Florida | |
| University of Florida | |
| University of North Florida | |
| University of South Florida | |
| University of West Florida |
Software procedure:
Step-by-step procedure to obtain dot-plot using MINITAB software:
- Choose Graph > Dot plot.
- Choose One Y, select simple and then click OK.
- In Graph variables, enter the column of Number of Violent Crimes Report.
- Click OK.
Observation:
From the dot plot, it can be observed that the schools Florida State University, Florida A&M University and New College of Florida stand out from the rest, since it has high crime rate than other schools.
Thus, the schools stand out as unusual are not same.
c.
Comment on the violent crimes reported at Florida universities and college in 2012 based on the part (a) and (b).
c.
Explanation of Solution
From part (a), it can be observed that there are three schools that stand out from the rest since these schools have higher number of crimes compared to the rest. However, majority of schools have almost similar and low number of crimes.
From part (b), it can be observed that there are three schools that stand out from the rest since these schools have higher crime rate compared to the rest.
Want to see more full solutions like this?
Chapter 1 Solutions
Bundle: Introduction to Statistics and Data Analysis, 5th + WebAssign Printed Access Card: Peck/Olsen/Devore. 5th Edition, Single-Term


- Harvard University California Institute of Technology Massachusetts Institute of Technology Stanford University Princeton University University of Cambridge University of Oxford University of California, Berkeley Imperial College London Yale University University of California, Los Angeles University of Chicago Johns Hopkins University Cornell University ETH Zurich University of Michigan University of Toronto Columbia University University of Pennsylvania Carnegie Mellon University University of Hong Kong University College London University of Washington Duke University Northwestern University University of Tokyo Georgia Institute of Technology Pohang University of Science and Technology University of California, Santa Barbara University of British Columbia University of North Carolina at Chapel Hill University of California, San Diego University of Illinois at Urbana-Champaign National University of Singapore McGill…arrow_forwardName Harvard University California Institute of Technology Massachusetts Institute of Technology Stanford University Princeton University University of Cambridge University of Oxford University of California, Berkeley Imperial College London Yale University University of California, Los Angeles University of Chicago Johns Hopkins University Cornell University ETH Zurich University of Michigan University of Toronto Columbia University University of Pennsylvania Carnegie Mellon University University of Hong Kong University College London University of Washington Duke University Northwestern University University of Tokyo Georgia Institute of Technology Pohang University of Science and Technology University of California, Santa Barbara University of British Columbia University of North Carolina at Chapel Hill University of California, San Diego University of Illinois at Urbana-Champaign National University of Singapore…arrow_forwardA company found that the daily sales revenue of its flagship product follows a normal distribution with a mean of $4500 and a standard deviation of $450. The company defines a "high-sales day" that is, any day with sales exceeding $4800. please provide a step by step on how to get the answers in excel Q: What percentage of days can the company expect to have "high-sales days" or sales greater than $4800? Q: What is the sales revenue threshold for the bottom 10% of days? (please note that 10% refers to the probability/area under bell curve towards the lower tail of bell curve) Provide answers in the yellow cellsarrow_forward
- Find the critical value for a left-tailed test using the F distribution with a 0.025, degrees of freedom in the numerator=12, and degrees of freedom in the denominator = 50. A portion of the table of critical values of the F-distribution is provided. Click the icon to view the partial table of critical values of the F-distribution. What is the critical value? (Round to two decimal places as needed.)arrow_forwardA retail store manager claims that the average daily sales of the store are $1,500. You aim to test whether the actual average daily sales differ significantly from this claimed value. You can provide your answer by inserting a text box and the answer must include: Null hypothesis, Alternative hypothesis, Show answer (output table/summary table), and Conclusion based on the P value. Showing the calculation is a must. If calculation is missing,so please provide a step by step on the answers Numerical answers in the yellow cellsarrow_forwardShow all workarrow_forward
 Glencoe Algebra 1, Student Edition, 9780079039897...AlgebraISBN:9780079039897Author:CarterPublisher:McGraw Hill
 Functions and Change: A Modeling Approach to Coll...AlgebraISBN:9781337111348Author:Bruce Crauder, Benny Evans, Alan NoellPublisher:Cengage Learning
 Holt Mcdougal Larson Pre-algebra: Student Edition...AlgebraISBN:9780547587776Author:HOLT MCDOUGALPublisher:HOLT MCDOUGAL
 Big Ideas Math A Bridge To Success Algebra 1: Stu...AlgebraISBN:9781680331141Author:HOUGHTON MIFFLIN HARCOURTPublisher:Houghton Mifflin Harcourt