
Introduction to Statistics and Data Analysis
5th Edition
ISBN: 9781305750999
Author: Peck Olson Devore
Publisher: CENGAGE C
expand_more
expand_more
format_list_bulleted
Concept explainers
Videos
Textbook Question
Chapter 1.4, Problem 19E
The article “Feasting on Protein” (AARP Bulletin, September 2009) gave the cost (in cents per gram) of protein for 19 common food sources of protein.
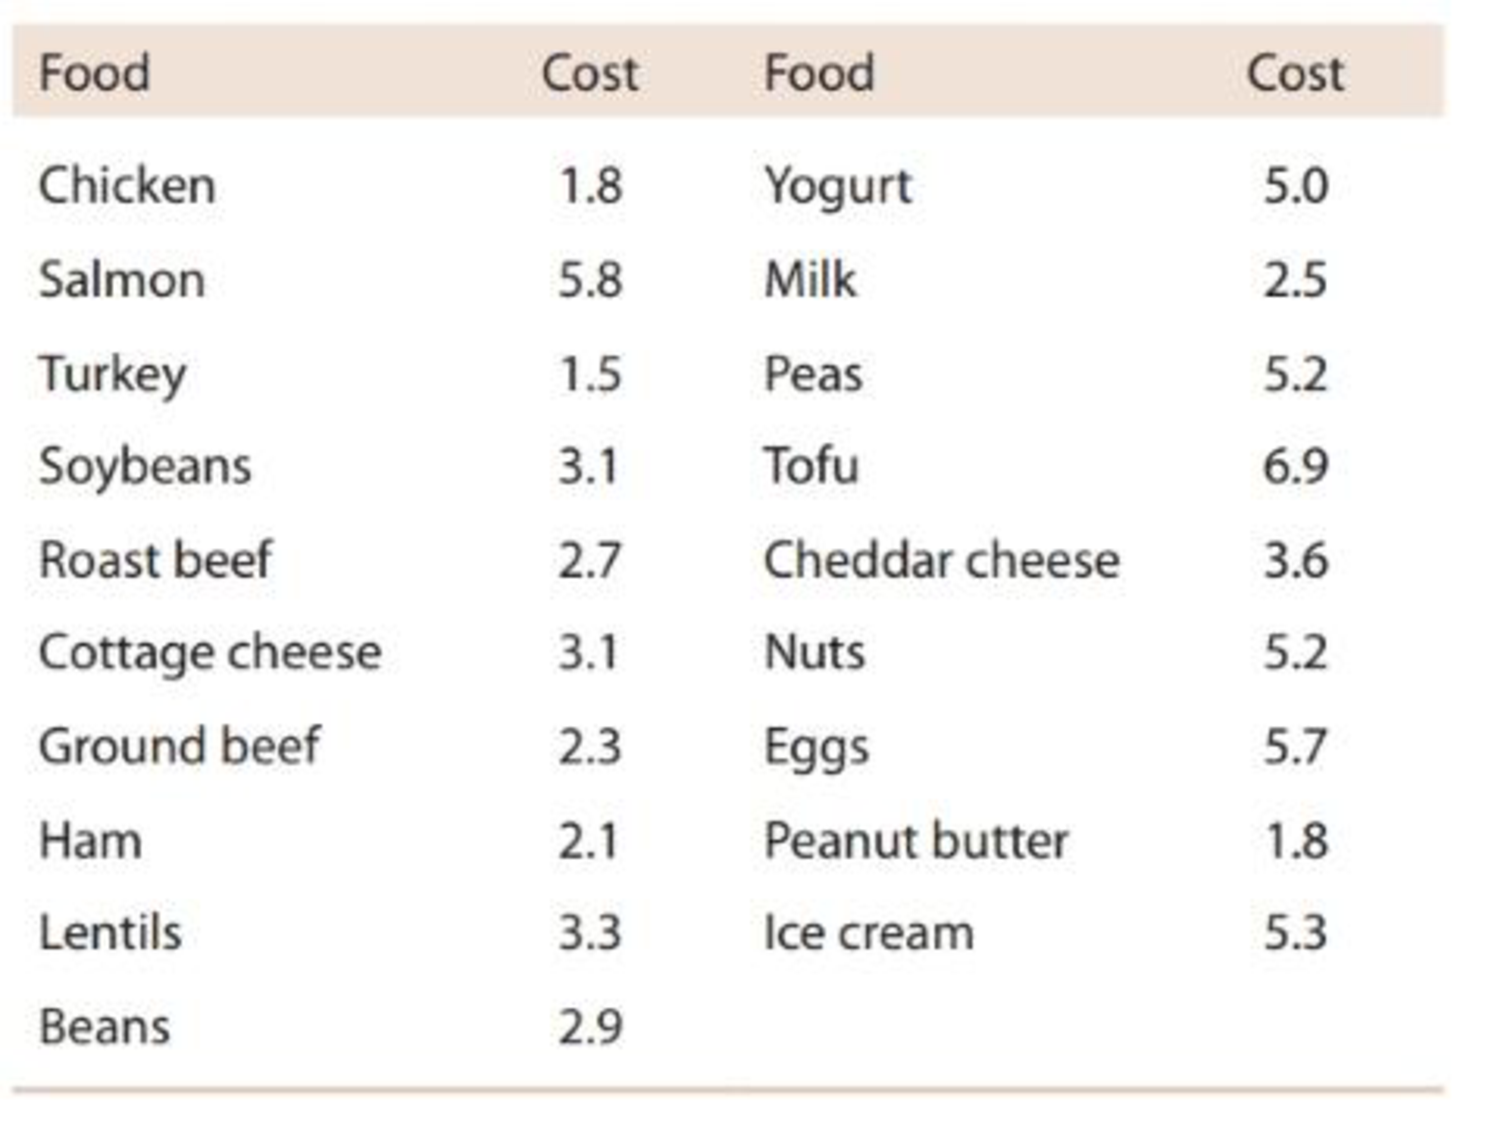
- a. Construct a dotplot of the cost data. (Hint: See Example 1.9.)
- b. Locale the cost for meat and poultry items in your dotplot and highlight them in a different color. Based on the dotplot, do meat and poultry items appear to be a good value? That is, do they appear to be relatively low cost compared to other sources of protein?
Expert Solution & Answer
Want to see the full answer?
Check out a sample textbook solution
Students have asked these similar questions
(a) Test the hypothesis.
Consider the hypothesis test Ho
=
:
against H₁o < 02. Suppose that the sample sizes aren₁ =
7 and n₂
= 13 and that
$²
= 22.4 and $22
= 28.2. Use α = 0.05.
Ho
is not
✓ rejected.
9-9
IV
(b) Find a 95% confidence interval on of 102. Round your answer to two decimal places (e.g. 98.76).
Let us suppose we have some article reported on a study of potential sources of injury to equine veterinarians conducted at a
university veterinary hospital. Forces on the hand were measured for several common activities that veterinarians engage in when
examining or treating horses. We will consider the forces on the hands for two tasks, lifting and using ultrasound. Assume that both
sample sizes are 6, the sample mean force for lifting was 6.2 pounds with standard deviation 1.5 pounds, and the sample mean force
for using ultrasound was 6.4 pounds with standard deviation 0.3 pounds. Assume that the standard deviations are known.
Suppose that you wanted to detect a true difference in mean force of 0.25 pounds on the hands for these two activities. Under the null
hypothesis, 40 = 0. What level of type II error would you recommend here?
Round your answer to four decimal places (e.g. 98.7654). Use a
= 0.05.
β
= i
What sample size would be required?
Assume the sample sizes are to be equal.…
=
Consider the hypothesis test Ho: μ₁ = μ₂ against H₁ μ₁ μ2. Suppose that sample sizes are n₁ =
15 and n₂ =
15, that x1 = 4.7
and X2 = 7.8 and that s² = 4 and s² = 6.26. Assume that o and that the data are drawn from normal distributions. Use
απ 0.05.
(a) Test the hypothesis and find the P-value.
(b) What is the power of the test in part (a) for a true difference in means of 3?
(c) Assuming equal sample sizes, what sample size should be used to obtain ẞ = 0.05 if the true difference in means is - 2? Assume
that α = 0.05.
(a) The null hypothesis is
98.7654).
rejected. The P-value is 0.0008
(b) The power is 0.94
. Round your answer to four decimal places (e.g.
Round your answer to two decimal places (e.g. 98.76).
(c) n₁ = n2 =
1
. Round your answer to the nearest integer.
Chapter 1 Solutions
Introduction to Statistics and Data Analysis
Ch. 1.3 - Give brief definitions of the terms descriptive...Ch. 1.3 - Give brief definitions of the terms population and...Ch. 1.3 - The following conclusion from a study appeared in...Ch. 1.3 - Based on a study of 2 121 children between the...Ch. 1.3 - The student senate at a university with 15,000...Ch. 1.3 - Prob. 6ECh. 1.3 - The supervisors of a rural county are interested...Ch. 1.3 - A consumer group conducts crash tests of new model...Ch. 1.3 - A building contractor has a chance to buy an odd...Ch. 1.3 - The article Brain Shunt Tested to Treat Alzheimers...
Ch. 1.3 - In a study of whether taking a garlic supplement...Ch. 1.4 - Classify each of the following variables as either...Ch. 1.4 - Classify each of the following variables as either...Ch. 1.4 - Prob. 14ECh. 1.4 - For the following numerical variables, state...Ch. 1.4 - For each of the following situations, give a set...Ch. 1.4 - In a survey of 100 people who had recently...Ch. 1.4 - Prob. 18ECh. 1.4 - The article Feasting on Protein (AARP Bulletin,...Ch. 1.4 - ● Box Office Mojo (www.boxofficcmojo.com) tracks...Ch. 1.4 - Prob. 21ECh. 1.4 - The following display is a graph similar to one...Ch. 1.4 - Prob. 23ECh. 1.4 - Prob. 24ECh. 1.4 - Prob. 25ECh. 1.4 - Prob. 26ECh. 1.4 - The article Fliers Trapped on Tarmac Push for...Ch. 1.4 - Prob. 28ECh. 1.4 - The article Where College Students Buy Textbooks...Ch. 1.4 - Prob. 30ECh. 1.4 - Prob. 31ECh. 1 - The report Testing the Waters 2009 (nrdc.org)...Ch. 1 - The U.S. Department of Education reported that 14%...Ch. 1 - The Computer Assisted Assessment Center at the...Ch. 1 - The article Just How Safe Is That Jet? (USA TODAY,...Ch. 1 - Each year, U.S. News and World Report publishes a...Ch. 1 - Many adolescent boys aspire to be professional...
Knowledge Booster


Learn more about
Need a deep-dive on the concept behind this application? Look no further. Learn more about this topic, statistics and related others by exploring similar questions and additional content below.Similar questions
- Consider the hypothesis test Ho: = 622 against H₁: 6 > 62. Suppose that the sample sizes are n₁ = 20 and n₂ = 8, and that = 4.5; s=2.3. Use a = 0.01. (a) Test the hypothesis. Round your answers to two decimal places (e.g. 98.76). The test statistic is fo = i The critical value is f = Conclusion: i the null hypothesis at a = 0.01. (b) Construct the confidence interval on 02/022 which can be used to test the hypothesis: (Round your answer to two decimal places (e.g. 98.76).) iarrow_forward2011 listing by carmax of the ages and prices of various corollas in a ceratin regionarrow_forwardس 11/ أ . اذا كانت 1 + x) = 2 x 3 + 2 x 2 + x) هي متعددة حدود محسوبة باستخدام طريقة الفروقات المنتهية (finite differences) من جدول البيانات التالي للدالة (f(x . احسب قيمة . ( 2 درجة ) xi k=0 k=1 k=2 k=3 0 3 1 2 2 2 3 αarrow_forward
- 1. Differentiate between discrete and continuous random variables, providing examples for each type. 2. Consider a discrete random variable representing the number of patients visiting a clinic each day. The probabilities for the number of visits are as follows: 0 visits: P(0) = 0.2 1 visit: P(1) = 0.3 2 visits: P(2) = 0.5 Using this information, calculate the expected value (mean) of the number of patient visits per day. Show all your workings clearly. Rubric to follow Definition of Random variables ( clearly and accurately differentiate between discrete and continuous random variables with appropriate examples for each) Identification of discrete random variable (correctly identifies "number of patient visits" as a discrete random variable and explains reasoning clearly.) Calculation of probabilities (uses the probabilities correctly in the calculation, showing all steps clearly and logically) Expected value calculation (calculate the expected value (mean)…arrow_forwardif the b coloumn of a z table disappeared what would be used to determine b column probabilitiesarrow_forwardConstruct a model of population flow between metropolitan and nonmetropolitan areas of a given country, given that their respective populations in 2015 were 263 million and 45 million. The probabilities are given by the following matrix. (from) (to) metro nonmetro 0.99 0.02 metro 0.01 0.98 nonmetro Predict the population distributions of metropolitan and nonmetropolitan areas for the years 2016 through 2020 (in millions, to four decimal places). (Let x, through x5 represent the years 2016 through 2020, respectively.) x₁ = x2 X3 261.27 46.73 11 259.59 48.41 11 257.96 50.04 11 256.39 51.61 11 tarrow_forward
- If the average price of a new one family home is $246,300 with a standard deviation of $15,000 find the minimum and maximum prices of the houses that a contractor will build to satisfy 88% of the market valuearrow_forward21. ANALYSIS OF LAST DIGITS Heights of statistics students were obtained by the author as part of an experiment conducted for class. The last digits of those heights are listed below. Construct a frequency distribution with 10 classes. Based on the distribution, do the heights appear to be reported or actually measured? Does there appear to be a gap in the frequencies and, if so, how might that gap be explained? What do you know about the accuracy of the results? 3 4 555 0 0 0 0 0 0 0 0 0 1 1 23 3 5 5 5 5 5 5 5 5 5 5 5 5 6 6 8 8 8 9arrow_forwardA side view of a recycling bin lid is diagramed below where two panels come together at a right angle. 45 in 24 in Width? — Given this information, how wide is the recycling bin in inches?arrow_forward
- 1 No. 2 3 4 Binomial Prob. X n P Answer 5 6 4 7 8 9 10 12345678 8 3 4 2 2552 10 0.7 0.233 0.3 0.132 7 0.6 0.290 20 0.02 0.053 150 1000 0.15 0.035 8 7 10 0.7 0.383 11 9 3 5 0.3 0.132 12 10 4 7 0.6 0.290 13 Poisson Probability 14 X lambda Answer 18 4 19 20 21 22 23 9 15 16 17 3 1234567829 3 2 0.180 2 1.5 0.251 12 10 0.095 5 3 0.101 7 4 0.060 3 2 0.180 2 1.5 0.251 24 10 12 10 0.095arrow_forwardstep by step on Microssoft on how to put this in excel and the answers please Find binomial probability if: x = 8, n = 10, p = 0.7 x= 3, n=5, p = 0.3 x = 4, n=7, p = 0.6 Quality Control: A factory produces light bulbs with a 2% defect rate. If a random sample of 20 bulbs is tested, what is the probability that exactly 2 bulbs are defective? (hint: p=2% or 0.02; x =2, n=20; use the same logic for the following problems) Marketing Campaign: A marketing company sends out 1,000 promotional emails. The probability of any email being opened is 0.15. What is the probability that exactly 150 emails will be opened? (hint: total emails or n=1000, x =150) Customer Satisfaction: A survey shows that 70% of customers are satisfied with a new product. Out of 10 randomly selected customers, what is the probability that at least 8 are satisfied? (hint: One of the keyword in this question is “at least 8”, it is not “exactly 8”, the correct formula for this should be = 1- (binom.dist(7, 10, 0.7,…arrow_forwardKate, Luke, Mary and Nancy are sharing a cake. The cake had previously been divided into four slices (s1, s2, s3 and s4). What is an example of fair division of the cake S1 S2 S3 S4 Kate $4.00 $6.00 $6.00 $4.00 Luke $5.30 $5.00 $5.25 $5.45 Mary $4.25 $4.50 $3.50 $3.75 Nancy $6.00 $4.00 $4.00 $6.00arrow_forward
arrow_back_ios
SEE MORE QUESTIONS
arrow_forward_ios
Recommended textbooks for you
 Glencoe Algebra 1, Student Edition, 9780079039897...AlgebraISBN:9780079039897Author:CarterPublisher:McGraw Hill
 Holt Mcdougal Larson Pre-algebra: Student Edition...AlgebraISBN:9780547587776Author:HOLT MCDOUGALPublisher:HOLT MCDOUGAL
 Big Ideas Math A Bridge To Success Algebra 1: Stu...AlgebraISBN:9781680331141Author:HOUGHTON MIFFLIN HARCOURTPublisher:Houghton Mifflin Harcourt
 Elementary Geometry For College Students, 7eGeometryISBN:9781337614085Author:Alexander, Daniel C.; Koeberlein, Geralyn M.Publisher:Cengage,
 Algebra: Structure And Method, Book 1AlgebraISBN:9780395977224Author:Richard G. Brown, Mary P. Dolciani, Robert H. Sorgenfrey, William L. ColePublisher:McDougal Littell
Glencoe Algebra 1, Student Edition, 9780079039897...
Algebra
ISBN:9780079039897
Author:Carter
Publisher:McGraw Hill
Holt Mcdougal Larson Pre-algebra: Student Edition...
Algebra
ISBN:9780547587776
Author:HOLT MCDOUGAL
Publisher:HOLT MCDOUGAL
Big Ideas Math A Bridge To Success Algebra 1: Stu...
Algebra
ISBN:9781680331141
Author:HOUGHTON MIFFLIN HARCOURT
Publisher:Houghton Mifflin Harcourt
Elementary Geometry For College Students, 7e
Geometry
ISBN:9781337614085
Author:Alexander, Daniel C.; Koeberlein, Geralyn M.
Publisher:Cengage,
Algebra: Structure And Method, Book 1
Algebra
ISBN:9780395977224
Author:Richard G. Brown, Mary P. Dolciani, Robert H. Sorgenfrey, William L. Cole
Publisher:McDougal Littell
Sampling Methods and Bias with Surveys: Crash Course Statistics #10; Author: CrashCourse;https://www.youtube.com/watch?v=Rf-fIpB4D50;License: Standard YouTube License, CC-BY
Statistics: Sampling Methods; Author: Mathispower4u;https://www.youtube.com/watch?v=s6ApdTvgvOs;License: Standard YouTube License, CC-BY