
(a)
The values of n and p.
(a)
Answer to Problem 14.25E
The value of n is 5 and value of p is 0.65.
Explanation of Solution
The given information is that the believer in the random walk theory of stock markets thinks that an index of stock prices has
The binomial distribution formula is
Where, n is the number of trials, x is the number of successes among n trials, p is the probability of successes, and q is the probability of failure.
As given that X is a binomial probability distribution, n is the total number of observations and p is the probability of success. As given that the probability of increasing in any year is 0.65, which shows probability of success so p is 0.65. Also given that X is the number of years among the next five years in which the index rises, which means the number of observation is 5 years so the value of n is 5.
Thus, the value of n is 5 and value of p is 0.65.
(b)
The possible values that X can take.
(b)
Answer to Problem 14.25E
The possible values that X can take are
Explanation of Solution
As given in the question that X denotes the number of years in which the index rises. As there are 5 total number of years, so the set of possible values that X can take are:
It is because the value of X could be 0 when there is no index rises in any year and 5 when index rises in all 5 years, similarly all other values are possible. So the possible values that X can take are
Thus, the possible values that X can take are
(c)
To find: The probability of each value of X.
(c)
Answer to Problem 14.25E
The probabilities of each value of X are 0.00525, 0.04875, 0.18115, 0.33642, 0.31239 and 0.11603 for values of X as 0, 1, 2, 3, 4, and 5 respectively.
Explanation of Solution
The binomial distribution formula is
Where, n is the number of trials, x is the number of successes among n trials, p is the probability of successes, and q is the probability of failure.
As discussed in part (a) that the possible values that X can take are
Where k denotes number of events occur which is all possible sets, n denotes total number of events which is 5, p denotes probability of success which is 0.65 and q denotes probability of fail which is 0.35. Now substitute these values and k as 0 in the binomial probability formula then:
So, the probability when X is equal to 0 is 0.00525. If k is 1 then the probability is:
So, the probability when X is equal to 1 is 0.04875. If k is 2 then the probability is:
So, the probability when X is equal to 2 is 0.18115. If k is 3 then the probability is:
So, the probability when X is equal to 3 is 0.33642. If k is 4 then the probability is:
So, the probability when X is equal to 4 is 0.31239. If k is 5 then the probability is:
So, the probability when X is equal to 5 is 0.11603.
Software procedure:
Step-by-step procedure to obtain the probability histogram for the distribution of X using the MINITAB software:
- Choose Graph > Probability Distribution Plot choose View Single > Click OK.
- From Distribution, choose ‘Binomial’ distribution.
- Enter the Number of trials as 5 and Event probability as 0.65.
- Click OK.
- Output using the MINITAB software is given below:
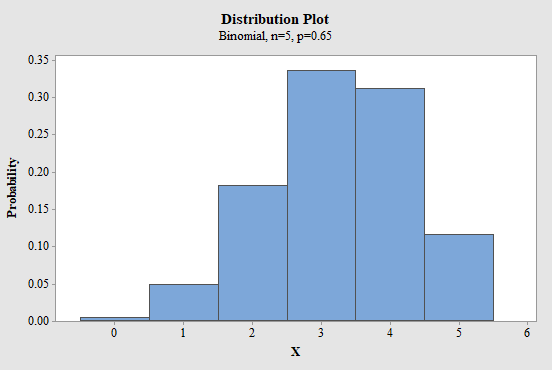
Figure-1
Conclusion:
The probabilities of each value of X are 0.00525, 0.04875, 0.18115, 0.33642, 0.31239 and 0.11603 for values of X as 0, 1, 2, 3, 4, and 5 respectively.
(d)
To calculate: The
To show: The location of the mean on the histogram.
(d)
Answer to Problem 14.25E
The mean of X is 3.25 and standard deviation of X is 1.1375.
Explanation of Solution
The binomial distribution formula is
Where, n is the number of trials, x is the number of successes among n trials, p is the probability of successes, and q is the probability of failure.
As given that X is a binomial probability distribution, so mean of X is calculated as:
Where
So, the mean of X is 3.25. Standard deviation of X is calculated as:
Where
So, the standard deviation of X is 1.1375. To show mean value on the histogram use the above histogram to show mean value of 3.25.

Figure-2
Conclusion:
The mean of X is 3.25 and standard deviation of X is 1.1375.
Want to see more full solutions like this?
Chapter 14 Solutions
Loose-leaf Version for The Basic Practice of Statistics 7e & LaunchPad (Twelve Month Access)

- appropriate probabilities. 19 Using the data from Table 17-1, are gender and political party independent for this group? nis cow sib signia si Falows grillor le pussarrow_forward11 Using the same toddler data, describe the toddlers with marginal probabilities only. BAY bit of benoliesmas (89 abje' jook stages of te cojota ing ou an out of to cojota ovig ber el ba 3+4=029arrow_forward21 Using the data from the table in Question 1, does the dominant hand differ for male toddlers versus female toddlers? (In other words, are these two events dependent?)arrow_forward
- op In a two-way table with variables A and B, does P(A|B) + P(A|B) = 1? பே 69 6 work as m 3 atavs ow to portabagabat sot gaisarrow_forwardIn a two-way table with variables A and B, does P(A|B)+P(A|B)=1? dsins/Ispino936) 1 durab ALED a to gilidadost Earrow_forwardpreference are dependent (you even have to look at the males). Using the bumper sticker data in the first example problem in this chapter, are car age and number of bumper stickers related (In other words, are these two events dependent?) d insbusqabni oss agit ads bms gliw woy tadi validadong ada 15W wex s m ad ow MP gliw Boy 1st yilidadong at al terW .d Shsed smo viaxe 5X9 of pe 012 from 12 or to HOM qose Aunt swam to prepants M&arrow_forward
- 23 வ dous biops Which marginal probabilities that you find in a two-way table should sum to 1? 著arrow_forwardUsing the toddler data from the table in Question 1 and appropriate probability notation, do the following: a. Compare the right-handed female and male toddlers in the sample, using condi- tional probabilities (only). b. Compare the right-handed toddlers asid in the sample, using conditional probabilities (only).dependent abni sis & bas bax bensqged snavs med) galworl andarrow_forwardUsing the toddler data from the table in Question 1 and appropriate probability notation, identify and calculate the following: a. What percentage of the male toddlers are right-handed? te b. What percentage of the female toddlers are right-handed? c. What percentage of the right-handed toddlers are male? d. What percentage of the right-handed toddlers are female?arrow_forward
- 10 Using the toddler data from the table in Question 1 and the appropriate probability Tonotation, identify and calculate ther s following: a. What percentage of the toddlers are right-handed? b. now to What percentage of the toddlers are female? female? da boit vom wo c. What proportion of the toddlers are left-handed? d. What's the chance of finding a male toddler from the sample? [10arrow_forward9 Using the car data from the bumper sticker table earlier in this chapter and the appro- priate probability notation, identify and calculate the following: a. What percentage of the cars are newer cars? b. What's the proportion of older cars? c. What percentage of the cars have a lot of bumper stickers? d. What's the probability that a car doesn't have a lot of bumper stickers?arrow_forwardSuppose that you roll a single die two times, and the trials are independent. What is the chance of rolling two 1s?arrow_forward
 MATLAB: An Introduction with ApplicationsStatisticsISBN:9781119256830Author:Amos GilatPublisher:John Wiley & Sons Inc
 Probability and Statistics for Engineering and th...StatisticsISBN:9781305251809Author:Jay L. DevorePublisher:Cengage Learning
 Statistics for The Behavioral Sciences (MindTap C...StatisticsISBN:9781305504912Author:Frederick J Gravetter, Larry B. WallnauPublisher:Cengage Learning
 Elementary Statistics: Picturing the World (7th E...StatisticsISBN:9780134683416Author:Ron Larson, Betsy FarberPublisher:PEARSON
 The Basic Practice of StatisticsStatisticsISBN:9781319042578Author:David S. Moore, William I. Notz, Michael A. FlignerPublisher:W. H. Freeman
 Introduction to the Practice of StatisticsStatisticsISBN:9781319013387Author:David S. Moore, George P. McCabe, Bruce A. CraigPublisher:W. H. Freeman