MATLAB: A Practical Introduction to Programming and Problem Solving
5th Edition
ISBN: 9780128154793
Author: Stormy Attaway Ph.D. Boston University
Publisher: Elsevier Science
expand_more
expand_more
format_list_bulleted
Concept explainers
Videos
Question
Chapter 14, Problem 14.1P
To determine
To find:
The minimum, maximum, arithmetic
Expert Solution & Answer
Answer to Problem 14.1P
Solution:
The required answers are stated as follows.
Explanation of Solution
MATLAB Code:
vector = [2 4 8 3 8];
minimum = min(vector)
maximum = max(vector)
mean_value = mean(vector)
variance_value = var(vector)
mode_value = mode(vector)
median_value = median(vector)
harmonic_mean = harmmean(vector)
geometric_mean = geomean(vector)
Save the MATLAB files with name, chapter14_54793_14_1P.m in the current folder. Execute the file by typing the name at the command window to generate output.
Result:
The result is,
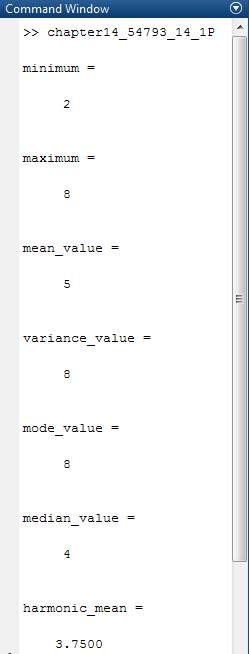

Therefore, the result is stated above.
Want to see more full solutions like this?
Subscribe now to access step-by-step solutions to millions of textbook problems written by subject matter experts!
Students have asked these similar questions
please find the answers for the yellows boxes using the information and the picture below
A marketing agency wants to determine whether different advertising platforms generate significantly different levels of customer engagement. The agency measures the average number of daily clicks on ads for three platforms: Social Media, Search Engines, and Email Campaigns. The agency collects data on daily clicks for each platform over a 10-day period and wants to test whether there is a statistically significant difference in the mean number of daily clicks among these platforms. Conduct ANOVA test.
You can provide your answer by inserting a text box and the answer must include: also please provide a step by on getting the answers in excel
Null hypothesis,
Alternative hypothesis,
Show answer (output table/summary table), and
Conclusion based on the P value.
A company found that the daily sales revenue of its flagship product follows a normal distribution with a mean of $4500 and a standard deviation of $450. The company defines a "high-sales day" that is, any day with sales exceeding $4800. please provide a step by step on how to get the answers
Q: What percentage of days can the company expect to have "high-sales days" or sales greater than $4800?
Q: What is the sales revenue threshold for the bottom 10% of days? (please note that 10% refers to the probability/area under bell curve towards the lower tail of bell curve)
Provide answers in the yellow cells
Chapter 14 Solutions
MATLAB: A Practical Introduction to Programming and Problem Solving
Ch. 14 - Prob. 14.1PCh. 14 - Prob. 14.2PCh. 14 - Prob. 14.3PCh. 14 - Prob. 14.4PCh. 14 - Prob. 14.5PCh. 14 - Prob. 14.6PCh. 14 - Prob. 14.7PCh. 14 - Prob. 14.8PCh. 14 - Prob. 14.9PCh. 14 - Prob. 1E
Ch. 14 - Prob. 2ECh. 14 - Prob. 3ECh. 14 - Prob. 4ECh. 14 - Prob. 6ECh. 14 - Prob. 7ECh. 14 - Prob. 8ECh. 14 - Prob. 9ECh. 14 - Prob. 10ECh. 14 - Prob. 11ECh. 14 - Prob. 12ECh. 14 - Prob. 14ECh. 14 - Prob. 15ECh. 14 - Prob. 16ECh. 14 - Prob. 17ECh. 14 - Prob. 18ECh. 14 - Prob. 19ECh. 14 - Prob. 20ECh. 14 - Prob. 22ECh. 14 - Prob. 23ECh. 14 - Prob. 24ECh. 14 - Prob. 25ECh. 14 - Prob. 26ECh. 14 - Prob. 27ECh. 14 - Prob. 28ECh. 14 - Prob. 29ECh. 14 - Prob. 30ECh. 14 - Prob. 31ECh. 14 - Prob. 32ECh. 14 - Prob. 33ECh. 14 - Prob. 34ECh. 14 - Prob. 35ECh. 14 - Prob. 36ECh. 14 - Prob. 37ECh. 14 - Prob. 38ECh. 14 - Prob. 39ECh. 14 - Prob. 40ECh. 14 - Prob. 41ECh. 14 - Prob. 42ECh. 14 - Prob. 43ECh. 14 - Prob. 44ECh. 14 - Prob. 45ECh. 14 - Prob. 46ECh. 14 - Prob. 47E
Knowledge Booster


Learn more about
Need a deep-dive on the concept behind this application? Look no further. Learn more about this topic, statistics and related others by exploring similar questions and additional content below.Similar questions
- Business Discussarrow_forwardThe following data represent total ventilation measured in liters of air per minute per square meter of body area for two independent (and randomly chosen) samples. Analyze these data using the appropriate non-parametric hypothesis testarrow_forwardeach column represents before & after measurements on the same individual. Analyze with the appropriate non-parametric hypothesis test for a paired design.arrow_forward
- Should you be confident in applying your regression equation to estimate the heart rate of a python at 35°C? Why or why not?arrow_forwardGiven your fitted regression line, what would be the residual for snake #5 (10 C)?arrow_forwardCalculate the 95% confidence interval around your estimate of r using Fisher’s z-transformation. In your final answer, make sure to back-transform to the original units.arrow_forward
arrow_back_ios
SEE MORE QUESTIONS
arrow_forward_ios
Recommended textbooks for you
 Holt Mcdougal Larson Pre-algebra: Student Edition...AlgebraISBN:9780547587776Author:HOLT MCDOUGALPublisher:HOLT MCDOUGAL
 Linear Algebra: A Modern IntroductionAlgebraISBN:9781285463247Author:David PoolePublisher:Cengage Learning
 Glencoe Algebra 1, Student Edition, 9780079039897...AlgebraISBN:9780079039897Author:CarterPublisher:McGraw Hill
 Big Ideas Math A Bridge To Success Algebra 1: Stu...AlgebraISBN:9781680331141Author:HOUGHTON MIFFLIN HARCOURTPublisher:Houghton Mifflin Harcourt
 Functions and Change: A Modeling Approach to Coll...AlgebraISBN:9781337111348Author:Bruce Crauder, Benny Evans, Alan NoellPublisher:Cengage Learning
Holt Mcdougal Larson Pre-algebra: Student Edition...
Algebra
ISBN:9780547587776
Author:HOLT MCDOUGAL
Publisher:HOLT MCDOUGAL
Linear Algebra: A Modern Introduction
Algebra
ISBN:9781285463247
Author:David Poole
Publisher:Cengage Learning
Glencoe Algebra 1, Student Edition, 9780079039897...
Algebra
ISBN:9780079039897
Author:Carter
Publisher:McGraw Hill
Big Ideas Math A Bridge To Success Algebra 1: Stu...
Algebra
ISBN:9781680331141
Author:HOUGHTON MIFFLIN HARCOURT
Publisher:Houghton Mifflin Harcourt
Functions and Change: A Modeling Approach to Coll...
Algebra
ISBN:9781337111348
Author:Bruce Crauder, Benny Evans, Alan Noell
Publisher:Cengage Learning
The Shape of Data: Distributions: Crash Course Statistics #7; Author: CrashCourse;https://www.youtube.com/watch?v=bPFNxD3Yg6U;License: Standard YouTube License, CC-BY
Shape, Center, and Spread - Module 20.2 (Part 1); Author: Mrmathblog;https://www.youtube.com/watch?v=COaid7O_Gag;License: Standard YouTube License, CC-BY
Shape, Center and Spread; Author: Emily Murdock;https://www.youtube.com/watch?v=_YyW0DSCzpM;License: Standard Youtube License