
Basic Business Statistics, Student Value Edition (13th Edition)
13th Edition
ISBN: 9780321946393
Author: Mark L. Berenson, David M. Levine, Kathryn A. Szabat
Publisher: PEARSON
expand_more
expand_more
format_list_bulleted
Concept explainers
Videos
Textbook Question
Chapter 14, Problem 10PS
The following ANOVA summary table is for a multiple regression model with two independent variables:
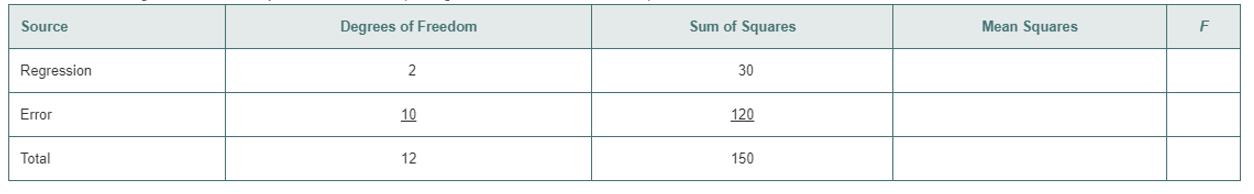
a. Determine the regression
b. Compute the overall
c. Determine whether there is a significant relationship between
d. Compute the coefficient of multiple determination,
e. Compute the adjusted
Expert Solution & Answer
Want to see the full answer?
Check out a sample textbook solution
Students have asked these similar questions
Find the critical value for a left-tailed test using the F distribution with a 0.025, degrees of freedom in the numerator=12, and degrees of freedom in the
denominator = 50. A portion of the table of critical values of the F-distribution is provided.
Click the icon to view the partial table of critical values of the F-distribution.
What is the critical value?
(Round to two decimal places as needed.)
A retail store manager claims that the average daily sales of the store are $1,500.
You aim to test whether the actual average daily sales differ significantly from this claimed value.
You can provide your answer by inserting a text box and the answer must include:
Null hypothesis,
Alternative hypothesis,
Show answer (output table/summary table), and
Conclusion based on the P value.
Showing the calculation is a must. If calculation is missing,so please provide a step by step on the answers
Numerical answers in the yellow cells
Show all work
Chapter 14 Solutions
Basic Business Statistics, Student Value Edition (13th Edition)
Ch. 14 - For this problem, use the following multiple...Ch. 14 - For this problem, use the following multiple...Ch. 14 - Prob. 3PSCh. 14 - Prob. 4PSCh. 14 - The production of wine is a multibillion-dollar...Ch. 14 - Prob. 6PSCh. 14 - Prob. 7PSCh. 14 - Prob. 8PSCh. 14 - The following ANOVA summary table is for a...Ch. 14 - The following ANOVA summary table is for a...
Ch. 14 - A financial analyst engaged in business valuation...Ch. 14 - Prob. 12PSCh. 14 - In Problem 14.5 on page 549, you used the...Ch. 14 - In Problem 14.4 on page 548, you used sales and...Ch. 14 - Prob. 15PSCh. 14 - Prob. 16PSCh. 14 - Prob. 17PSCh. 14 - Prob. 18PSCh. 14 - In Problem 14.5 on page 542, you used the...Ch. 14 - In Problem 14.6 on page 549, you used radio...Ch. 14 - In Problem 14.7 on page 549, you used the total...Ch. 14 - Prob. 22PSCh. 14 - Prob. 23PSCh. 14 - Prob. 24PSCh. 14 - Prob. 25PSCh. 14 - Prob. 26PSCh. 14 - Prob. 27PSCh. 14 - Prob. 28PSCh. 14 - Prob. 29PSCh. 14 - Prob. 30PSCh. 14 - The following is the ANOVA summary table for a...Ch. 14 - The following is the ANOVA summary table for a...Ch. 14 - In Problem 14.5 on page 542, you used alcohol...Ch. 14 - Prob. 34PSCh. 14 - Prob. 35PSCh. 14 - Prob. 36PSCh. 14 - Prob. 37PSCh. 14 - Suppose X1 is a numerical variable and X2 is a...Ch. 14 - The chair of the accounting department plans to...Ch. 14 - A real estate association in a suburban community...Ch. 14 - In Problem 14.5 on page 542, you developed a...Ch. 14 - In mining engineering, holes are often drilled...Ch. 14 - The owner of a moving company typically has his...Ch. 14 - Prob. 44PSCh. 14 - Zagat’s publishes restaurant ratings for various...Ch. 14 - Prob. 46PSCh. 14 - In Problem 14.5 on page 542, the percentage of...Ch. 14 - Prob. 48PSCh. 14 - The director of a training program for a large...Ch. 14 - Prob. 50PSCh. 14 - Prob. 51PSCh. 14 - Prob. 52PSCh. 14 - Prob. 53PSCh. 14 - Prob. 54PSCh. 14 - Prob. 55PSCh. 14 - Prob. 56PSCh. 14 - Prob. 57PSCh. 14 - An automotive insurance company wants to predict...Ch. 14 - A marketing manager wants to predict customer with...Ch. 14 - Prob. 60PSCh. 14 - Prob. 61PSCh. 14 - Prob. 62PSCh. 14 - Prob. 63PSCh. 14 - Prob. 64PSCh. 14 - Prob. 65PSCh. 14 - Prob. 66PSCh. 14 - Prob. 67PSCh. 14 - Prob. 68PSCh. 14 - Prob. 69PSCh. 14 - Prob. 70PSCh. 14 - Prob. 71PSCh. 14 - Prob. 72PSCh. 14 - Prob. 73PSCh. 14 - What is the difference between the hat matrix...Ch. 14 - Prob. 75PSCh. 14 - The owner of a moving company typically has his...Ch. 14 - Professional basketball has truly become a sport...Ch. 14 - A sample of 30 houses recently listed for sale in...Ch. 14 - Measuring the height of a California redwood tree...Ch. 14 - A sample of 30 houses recently listed for sale in...Ch. 14 - A baseball analysis specialist wants to determine...Ch. 14 - Referring to Problem 14.81, suppose that in...Ch. 14 - Prob. 83PSCh. 14 - Prob. 84PSCh. 14 - Prob. 85PSCh. 14 - Prob. 86PSCh. 14 - Prob. 87PS
Knowledge Booster


Learn more about
Need a deep-dive on the concept behind this application? Look no further. Learn more about this topic, statistics and related others by exploring similar questions and additional content below.Similar questions
- Show all workarrow_forwardplease find the answers for the yellows boxes using the information and the picture belowarrow_forwardA marketing agency wants to determine whether different advertising platforms generate significantly different levels of customer engagement. The agency measures the average number of daily clicks on ads for three platforms: Social Media, Search Engines, and Email Campaigns. The agency collects data on daily clicks for each platform over a 10-day period and wants to test whether there is a statistically significant difference in the mean number of daily clicks among these platforms. Conduct ANOVA test. You can provide your answer by inserting a text box and the answer must include: also please provide a step by on getting the answers in excel Null hypothesis, Alternative hypothesis, Show answer (output table/summary table), and Conclusion based on the P value.arrow_forward
- A company found that the daily sales revenue of its flagship product follows a normal distribution with a mean of $4500 and a standard deviation of $450. The company defines a "high-sales day" that is, any day with sales exceeding $4800. please provide a step by step on how to get the answers Q: What percentage of days can the company expect to have "high-sales days" or sales greater than $4800? Q: What is the sales revenue threshold for the bottom 10% of days? (please note that 10% refers to the probability/area under bell curve towards the lower tail of bell curve) Provide answers in the yellow cellsarrow_forwardBusiness Discussarrow_forwardThe following data represent total ventilation measured in liters of air per minute per square meter of body area for two independent (and randomly chosen) samples. Analyze these data using the appropriate non-parametric hypothesis testarrow_forward
arrow_back_ios
SEE MORE QUESTIONS
arrow_forward_ios
Recommended textbooks for you
 Functions and Change: A Modeling Approach to Coll...AlgebraISBN:9781337111348Author:Bruce Crauder, Benny Evans, Alan NoellPublisher:Cengage Learning
 Glencoe Algebra 1, Student Edition, 9780079039897...AlgebraISBN:9780079039897Author:CarterPublisher:McGraw Hill
 Big Ideas Math A Bridge To Success Algebra 1: Stu...AlgebraISBN:9781680331141Author:HOUGHTON MIFFLIN HARCOURTPublisher:Houghton Mifflin Harcourt
Functions and Change: A Modeling Approach to Coll...
Algebra
ISBN:9781337111348
Author:Bruce Crauder, Benny Evans, Alan Noell
Publisher:Cengage Learning
Glencoe Algebra 1, Student Edition, 9780079039897...
Algebra
ISBN:9780079039897
Author:Carter
Publisher:McGraw Hill
Big Ideas Math A Bridge To Success Algebra 1: Stu...
Algebra
ISBN:9781680331141
Author:HOUGHTON MIFFLIN HARCOURT
Publisher:Houghton Mifflin Harcourt
Mod-01 Lec-01 Discrete probability distributions (Part 1); Author: nptelhrd;https://www.youtube.com/watch?v=6x1pL9Yov1k;License: Standard YouTube License, CC-BY
Discrete Probability Distributions; Author: Learn Something;https://www.youtube.com/watch?v=m9U4UelWLFs;License: Standard YouTube License, CC-BY
Probability Distribution Functions (PMF, PDF, CDF); Author: zedstatistics;https://www.youtube.com/watch?v=YXLVjCKVP7U;License: Standard YouTube License, CC-BY
Discrete Distributions: Binomial, Poisson and Hypergeometric | Statistics for Data Science; Author: Dr. Bharatendra Rai;https://www.youtube.com/watch?v=lHhyy4JMigg;License: Standard Youtube License