Organic Chemistry (9th Edition)
9th Edition
ISBN: 9780321971371
Author: Leroy G. Wade, Jan W. Simek
Publisher: PEARSON
expand_more
expand_more
format_list_bulleted
Concept explainers
Videos
Textbook Question
Chapter 13.6, Problem 13.3P
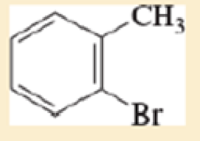
Determine the number of different kinds of protons in each compound.
- a. 1-chlcropropane
- b. 2-chloropropane
- c. 2,2-dimethylbutane
- d. 2,3-dimethylbutane
- e. 1 bromo-4-methylbenzene
- f. 1-bromo-2-methylbenzene
Expert Solution & Answer
Want to see the full answer?
Check out a sample textbook solution
Students have asked these similar questions
pressure (atm)
3
The pressure on a sample of pure X held at 47. °C and 0.88 atm is increased until the sample condenses. The pressure is then held constant and the
temperature is decreased by 82. °C. On the phase diagram below draw a path that shows this set of changes.
0
0
200
temperature (K)
400
а
er your payment details | bar xb Home | bartleby
x +
aleksogi/x/isl.exe/1o u-lgNskr7j8P3jH-1Qs_pBanHhviTCeeBZbufuBYT0Hz7m7D3ZcW81NC1d8Kzb4srFik1OUFhKMUXzhGpw7k1
O States of Matter
Sketching a described thermodynamic change on a phase diagram
0/5
The pressure on a sample of pure X held at 47. °C and 0.88 atm is increased until the sample condenses. The pressure is then held constant and the
temperature is decreased by 82. °C. On the phase diagram below draw a path that shows this set of changes.
pressure (atm)
1
3-
0-
0
200
Explanation
Check
temperature (K)
400
X
Q Search
L
G
2025 McGraw Hill LLC. All Rights Reserved Terms of Use Privacy Ce
5.
Chapter 13 Solutions
Organic Chemistry (9th Edition)
Ch. 13.5A - In a 300-MHz spectrometer, the protons in...Ch. 13.5B - Prob. 13.2PCh. 13.6 - Determine the number of different kinds of protons...Ch. 13.6 - Prob. 13.4PCh. 13.7 - Draw the integral trace expected for the NMR...Ch. 13.7 - Prob. 13.6PCh. 13.8C - Draw the NMR spectra you would expect for the...Ch. 13.8D - Draw the NMR spectra you expect for the following...Ch. 13.8D - a. Assign protons to the peaks in the NMR spectrum...Ch. 13.8D - Prob. 13.10P
Ch. 13.8D - Two spectra are shown. Propose a structure that...Ch. 13.9 - Prob. 13.12PCh. 13.9 - The spectrum of trans-hex-2-enoic acid follows. a....Ch. 13.9 - Prob. 13.14PCh. 13.9 - Prob. 13.15PCh. 13.10 - Prob. 13.16PCh. 13.10 - If the imaginary replacement of either of two...Ch. 13.10 - Predict the theoretical number of different NMR...Ch. 13.11B - Prob. 13.19PCh. 13.11B - Prob. 13.20PCh. 13.11B - Prob. 13.21PCh. 13.11B - Prob. 13.22PCh. 13.11B - Prob. 13.23PCh. 13.11B - Prob. 13.24PCh. 13.12E - Draw the expected broadband-decoupled 13 C N M R...Ch. 13.12E - a. Show which carbon atoms correspond with which...Ch. 13.12E - Repeat Problem13-25, sketching the...Ch. 13.12F - Prob. 13.28PCh. 13.13 - A bottle of allyl bromide was found to contain a...Ch. 13.13 - A laboratory student was converting cyclohexanol...Ch. 13.14 - Sets of spectra are given for two compounds. For...Ch. 13 - An unknown compound has the molecular formula C 9...Ch. 13 - Prob. 13.34SPCh. 13 - Predict the approximate chemical shifts of the...Ch. 13 - Prob. 13.36SPCh. 13 - Prob. 13.37SPCh. 13 - Prob. 13.38SPCh. 13 - Prob. 13.39SPCh. 13 - Prob. 13.40SPCh. 13 - For each compound shown below. 1. sketch the 13 C...Ch. 13 - Prob. 13.42SPCh. 13 - Prob. 13.43SPCh. 13 - Prob. 13.44SPCh. 13 - Prob. 13.45SPCh. 13 - Prob. 13.46SPCh. 13 - A compound was isolated as a minor constituent in...Ch. 13 - Prob. 13.48SPCh. 13 - The three isomers of dimethylbenzene are commonly...Ch. 13 - a. Draw all six isomers of formula C 4 H 8...Ch. 13 - Prob. 13.51SPCh. 13 - Hexamethylbenzene undergoes free-radical...Ch. 13 - Each of these four structures has molecular...Ch. 13 - Prob. 13.54SPCh. 13 - Phenyl Grignard reagent adds to 2-methylpropanal...Ch. 13 - Prob. 13.56SP
Knowledge Booster


Learn more about
Need a deep-dive on the concept behind this application? Look no further. Learn more about this topic, chemistry and related others by exploring similar questions and additional content below.Similar questions
- 6.arrow_forward0/5 alekscgi/x/sl.exe/1o_u-IgNglkr7j8P3jH-IQs_pBaHhvlTCeeBZbufuBYTi0Hz7m7D3ZcSLEFovsXaorzoFtUs | AbtAURtkqzol 1HRAS286, O States of Matter Sketching a described thermodynamic change on a phase diagram The pressure on a sample of pure X held at 47. °C and 0.88 atm is increased until the sample condenses. The pressure is then held constant and the temperature is decreased by 82. °C. On the phase diagram below draw a path that shows this set of changes. 3 pressure (atm) + 0- 0 5+ 200 temperature (K) 400 Explanation Check X 0+ F3 F4 F5 F6 F7 S 2025 McGraw Hill LLC All Rights Reserved. Terms of Use Privacy Center Accessibility Q Search LUCR + F8 F9 F10 F11 F12 * % & ( 5 6 7 8 9 Y'S Dele Insert PrtSc + Backsarrow_forward5.arrow_forward
- 9arrow_forwardalekscgi/x/lsl.exe/1o_u-IgNslkr7j8P3jH-IQs_pBanHhvlTCeeBZbufu BYTI0Hz7m7D3ZS18w-nDB10538ZsAtmorZoFusYj2Xu9b78gZo- O States of Matter Sketching a described thermodynamic change on a phase diagram 0/5 The pressure on a sample of pure X held at 47. °C and 0.88 atm is increased until the sample condenses. The pressure is then held constant and the temperature is decreased by 82. °C. On the phase diagram below draw a path that shows this set of changes. pressure (atm) 3- 200 temperature (K) Explanation Chick Q Sowncharrow_forward0+ aleksog/x/lsl.exe/1ou-lgNgkr7j8P3H-IQs pBaHhviTCeeBZbufuBYTOHz7m7D3ZStEPTBSB3u9bsp3Da pl19qomOXLhvWbH9wmXW5zm O States of Matter Sketching a described thermodynamic change on a phase diagram 0/5 Gab The temperature on a sample of pure X held at 0.75 atm and -229. °C is increased until the sample sublimes. The temperature is then held constant and the pressure is decreased by 0.50 atm. On the phase diagram below draw a path that shows this set of changes. F3 pressure (atm) 0- 0 200 Explanation temperature (K) Check F4 F5 ☀+ Q Search Chill Will an 9 ENG F6 F7 F8 F9 8 Delete F10 F11 F12 Insert PrtSc 114 d Ararrow_forward
- x + LEKS: Using a phase diagram a X n/alekscgi/x/lsl.exe/10_u-IgNsikr7j8P3jH-IQs_pBan HhvlTCeeBZbufu BYTI0Hz7m7D3ZcHYUt80XL-5alyVpw ○ States of Matter Using a phase diagram to find a phase transition temperature or pressure Use the phase diagram of Substance X below to find the melting point of X when the pressure above the solid is 1.1 atm. pressure (atm) 16 08- solid liquid- 0 200 400 gas 600 temperature (K) Note: your answer must be within 25 °C of the exact answer to be graded correct. × 5arrow_forwardS: Using a phase diagram leksogi/x/sl.exe/1ou-IgNs kr 7j8P3jH-IQs_pBan HhvTCeeBZbufuBYTI0Hz7m7D3ZdHYU+80XL-5alyVp O States of Matter Using a phase diagram to find a phase transition temperature or pressure se the phase diagram of Substance X below to find the boiling point of X when the pressure on the liquid is 1.6 atm. pressure (atm) 32- 16- solid liquid 0. gas 100 200 temperature (K) 300 Note: your answer must be within 12.5 °C of the exact answer to be graded correct. 10 Explanation Check § Q Search J 2025 McGraw Hill LLC. All Rights Researrow_forward151.2 254.8 85.9 199.6 241.4 87.6 242.5 186.4 155.8 257.1 242.9 253.3 256.0 216.6 108.7 239.0 149.7 236.4 152.1 222.7 148.7 278.2 268.7 234.4 262.7 283.2 143.6 QUESTION: Using this group of data on salt reduced tomato sauce concentration readings answer the following questions: 1. 95% Cl Confidence Interval (mmol/L) 2. [Na+] (mg/100 mL) 3. 95% Na+ Confidence Interval (mg/100 mL)arrow_forward
- Results Search Results Best Free Coursehero Unloc xb Success Confirmation of Q x O Google Pas alekscgi/x/lsl.exe/1o_u-IgNslkr 7j8P3jH-IQs_pBanHhvlTCeeBZbufu BYTI0Hz7m7D3ZcHYUt80XL-5alyVpwDXM TEZayFYCavJ17dZtpxbFD0Qggd1J O States of Matter Using a phase diagram to find a phase transition temperature or pressure Gabr 3/5 he pressure above a pure sample of solid Substance X at 101. °C is lowered. At what pressure will the sample sublime? Use the phase diagram of X below to nd your answer. pressure (atm) 24- 12 solid liquid gas 200 400 temperature (K) 600 ote: your answer must be within 0.15 atm of the exact answer to be graded correct. atm Thanation Check © 2025 McGraw Hill LLC. All Rights Reserved. Terms of Use | Privacy Center I Q Search L³ ملةarrow_forward301.7 348.9 193.7 308.6 339.5 160.6 337.7 464.7 223.5 370.5 326.6 327.5 336.1 317.9 203.8 329.8 221.9 331.7 211.7 309.6 223.4 353.7 334.6 305.6 340.0 304.3 244.7 QUESTION: Using this group of data on regular tomato sauce concentration readings answer the following questions: 1. 95% Cl Confidence Interval (mmol/L) 2. [Na+] (mg/100 mL) 3. 95% Na+ Confidence Interval (mg/100 mL)arrow_forwardSearch Results Search Results Best Free Coursehero Unlo x b Success Confirmation of Q aleks.com/alekscgi/x/sl.exe/10_u-lgNslkr7j8P3jH-IQs_pBan HhvlTCeeBZbufu BYTIOHz7m7D3ZcHYUt80XL-5alyVpwDXM TEZayFYCav States of Matter Using a phase diagram to find a phase transition temperature or pressure Use the phase diagram of Substance X below to find the temperature at which X turns to a gas, if the pressure above the solid is 3.7 atm. pressure (atm) 0. 32- 16 solid liquid gas 200 temperature (K) Note: your answer must be within 20 °C of the exact answer to be graded correct. Дос Xarrow_forward
arrow_back_ios
SEE MORE QUESTIONS
arrow_forward_ios
Recommended textbooks for you
 Introductory Chemistry: A FoundationChemistryISBN:9781337399425Author:Steven S. Zumdahl, Donald J. DeCostePublisher:Cengage Learning
Introductory Chemistry: A Foundation
Chemistry
ISBN:9781337399425
Author:Steven S. Zumdahl, Donald J. DeCoste
Publisher:Cengage Learning
Nomenclature: Crash Course Chemistry #44; Author: CrashCourse;https://www.youtube.com/watch?v=U7wavimfNFE;License: Standard YouTube License, CC-BY