
Modern Business Statistics with Microsoft Office Excel (with XLSTAT Education Edition Printed Access Card) (MindTap Course List)
6th Edition
ISBN: 9781337115186
Author: David R. Anderson, Dennis J. Sweeney, Thomas A. Williams, Jeffrey D. Camm, James J. Cochran
Publisher: Cengage Learning
expand_more
expand_more
format_list_bulleted
Videos
Textbook Question
Chapter 13.4, Problem 21E
Consider the experimental results for the following randomized block design. Make the calculations necessary to set up the analysis of variance table.
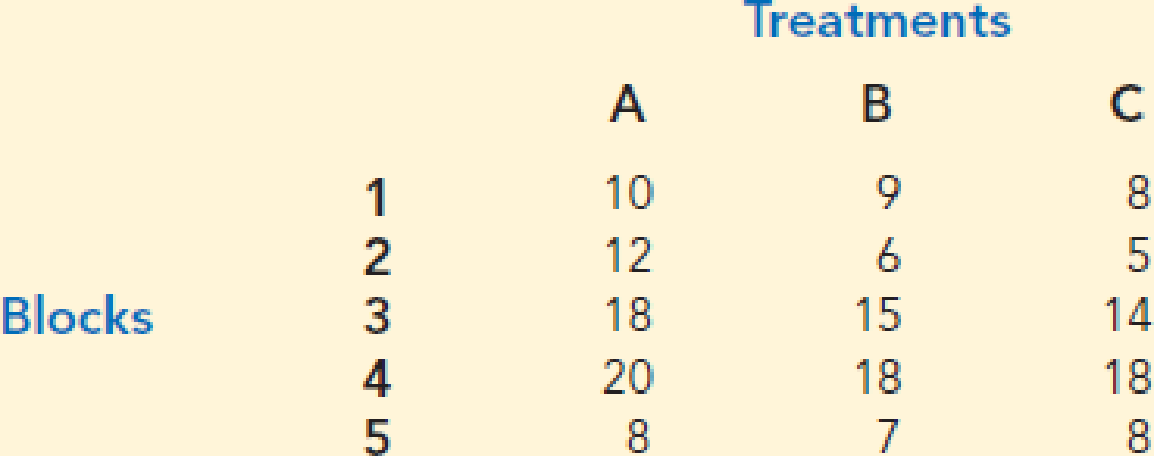
Use α = .05 to test for any significant differences.
Expert Solution & Answer

Trending nowThis is a popular solution!

Students have asked these similar questions
Show all work
Show all work
Show all work
Chapter 13 Solutions
Modern Business Statistics with Microsoft Office Excel (with XLSTAT Education Edition Printed Access Card) (MindTap Course List)
Ch. 13.2 - 1. The following data are from a completely...Ch. 13.2 - 2. In a completely randomized design, seven...Ch. 13.2 - 3. Refer to exercise 2.
what hypotheses are...Ch. 13.2 - Prob. 4ECh. 13.2 - 5. In a completely randomized design, 12...Ch. 13.2 - Prob. 6ECh. 13.2 - 7. Three different methods for assembling a...Ch. 13.2 - Prob. 8ECh. 13.2 - 9. To study the effect of temperature on yield in...Ch. 13.2 - Prob. 10E
Ch. 13.2 - Four different paints are advertised as having the...Ch. 13.2 - Restaurant Satisfaction. The Consumer Reports...Ch. 13.3 - The following data are from a completely...Ch. 13.3 - Prob. 14ECh. 13.3 - Testing Chemical Processes. To test whether the...Ch. 13.3 - Prob. 16ECh. 13.3 - Marketing Ethics. In the digital age of marketing,...Ch. 13.3 - Prob. 18ECh. 13.3 - Prob. 19ECh. 13.3 - Minor league Baseball Attendance. The...Ch. 13.4 - Consider the experimental results for the...Ch. 13.4 - Prob. 22ECh. 13.4 - 23. An experiment has been conducted for four...Ch. 13.4 - Prob. 24ECh. 13.4 - The price drivers pay for gasoline often varies a...Ch. 13.4 - SAT Performance. The Scholastic Aptitude Test...Ch. 13.4 - A study reported in the Journal of the American...Ch. 13.5 - A factorial experiment involving two levels of...Ch. 13.5 - Prob. 29ECh. 13.5 - Prob. 30ECh. 13.5 - Amusement Park Queues. An amusement park studied...Ch. 13.5 - Prob. 32ECh. 13.5 - Prob. 33ECh. 13 - In a completely randomized experimental design,...Ch. 13 - Prob. 35SECh. 13 - Prob. 36SECh. 13 - Prob. 37SECh. 13 - Assembly Methods. Three different assembly methods...Ch. 13 - In a study conducted to investigate browsing...Ch. 13 - Fuel Efficiency of Gasoline Brands. A research...Ch. 13 - Late-Night Talk Show Viewership. Jimmy Kimmel...Ch. 13 - Prob. 42SECh. 13 - Prob. 43SECh. 13 - Prob. 44SECh. 13 - CASE PROBLEM 1: WENTWORTH MEDICAL CENTER As part...Ch. 13 - CASE PROBLEM 2: COMPENSATION FOR SALES...Ch. 13 - TOURISTOPIA TRAVEL TourisTopia Travel (Triple T)...
Knowledge Booster


Learn more about
Need a deep-dive on the concept behind this application? Look no further. Learn more about this topic, statistics and related others by exploring similar questions and additional content below.Similar questions
- A marketing agency wants to determine whether different advertising platforms generate significantly different levels of customer engagement. The agency measures the average number of daily clicks on ads for three platforms: Social Media, Search Engines, and Email Campaigns. The agency collects data on daily clicks for each platform over a 10-day period and wants to test whether there is a statistically significant difference in the mean number of daily clicks among these platforms. Conduct ANOVA test. You can provide your answer by inserting a text box and the answer must include: also please provide a step by on getting the answers in excel Null hypothesis, Alternative hypothesis, Show answer (output table/summary table), and Conclusion based on the P value.arrow_forwardA company found that the daily sales revenue of its flagship product follows a normal distribution with a mean of $4500 and a standard deviation of $450. The company defines a "high-sales day" that is, any day with sales exceeding $4800. please provide a step by step on how to get the answers Q: What percentage of days can the company expect to have "high-sales days" or sales greater than $4800? Q: What is the sales revenue threshold for the bottom 10% of days? (please note that 10% refers to the probability/area under bell curve towards the lower tail of bell curve) Provide answers in the yellow cellsarrow_forwardBusiness Discussarrow_forward
- The following data represent total ventilation measured in liters of air per minute per square meter of body area for two independent (and randomly chosen) samples. Analyze these data using the appropriate non-parametric hypothesis testarrow_forwardeach column represents before & after measurements on the same individual. Analyze with the appropriate non-parametric hypothesis test for a paired design.arrow_forwardShould you be confident in applying your regression equation to estimate the heart rate of a python at 35°C? Why or why not?arrow_forward
arrow_back_ios
SEE MORE QUESTIONS
arrow_forward_ios
Recommended textbooks for you
 Glencoe Algebra 1, Student Edition, 9780079039897...AlgebraISBN:9780079039897Author:CarterPublisher:McGraw Hill
Glencoe Algebra 1, Student Edition, 9780079039897...
Algebra
ISBN:9780079039897
Author:Carter
Publisher:McGraw Hill
Introduction to experimental design and analysis of variance (ANOVA); Author: Dr. Bharatendra Rai;https://www.youtube.com/watch?v=vSFo1MwLoxU;License: Standard YouTube License, CC-BY