
Introductory Statistics (10th Edition)
10th Edition
ISBN: 9780321989178
Author: Neil A. Weiss
Publisher: PEARSON
expand_more
expand_more
format_list_bulleted
Videos
Textbook Question
Chapter 13.3, Problem 51E
Farms. The U.S. Department of Agriculture publishes information about U.S. farms in Census of Agriculture. A joint frequency distribution for number of farms, by acreage and tenure of operator, is provided in the following
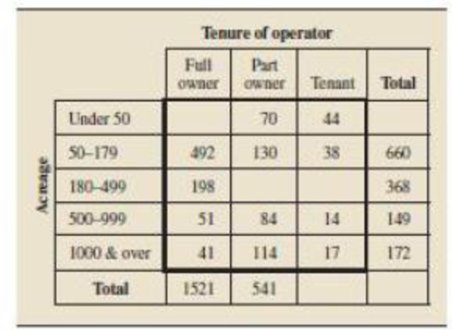
- a. Fill in the six missing entries.
- b. How many cells does this contingency table have?
- c. How many farms have under 50 acres?
- d. How many farms are tenant operated?
- e. How many farms are operated by part owners and have between 500 acres and 999 acres, inclusive?
- f. How many farms are not full-owner operated?
- g. How many tenant-operated farms have 180 acres or more?
Expert Solution & Answer
Want to see the full answer?
Check out a sample textbook solution
Students have asked these similar questions
The following ordered data list shows the data speeds for cell phones used by a
telephone company at an airport:
A. Calculate the Measures of Central Tendency from the ungrouped data list.
B. Group the data in an appropriate frequency table.
C. Calculate the Measures of Central Tendency using the table in point B.
0.8
1.4
1.8
1.9
3.2
3.6
4.5
4.5
4.6
6.2
6.5
7.7
7.9
9.9
10.2
10.3
10.9
11.1
11.1
11.6
11.8
12.0
13.1
13.5
13.7
14.1
14.2
14.7
15.0
15.1
15.5
15.8
16.0
17.5
18.2
20.2
21.1
21.5
22.2
22.4
23.1
24.5
25.7
28.5
34.6
38.5
43.0
55.6
71.3
77.8
II Consider the following data matrix X:
X1
X2
0.5
0.4
0.2 0.5
0.5
0.5
10.3 10
10.1 10.4
10.1
10.5
What will the resulting clusters be when using the k-Means method with k = 2. In your own words, explain why this result is
indeed expected, i.e. why this clustering minimises the ESS map.
why the answer is 3 and 10?
Chapter 13 Solutions
Introductory Statistics (10th Edition)
Ch. 13.1 - What is meant by saying that a variable has a...Ch. 13.1 - How do you identify different chi-square...Ch. 13.1 - Prob. 3ECh. 13.1 - The t-table has entries for areas of 0.10, 0.05,...Ch. 13.1 - Prob. 5ECh. 13.1 - In Exercises 13.5-13.8, use Table VII to find the...Ch. 13.1 - Prob. 7ECh. 13.1 - Prob. 8ECh. 13.2 - Why is the phrase goodness of fit used to describe...Ch. 13.2 - Prob. 10E
Ch. 13.2 - Prob. 11ECh. 13.2 - Prob. 12ECh. 13.2 - Prob. 13ECh. 13.2 - Prob. 14ECh. 13.2 - Prob. 15ECh. 13.2 - Prob. 16ECh. 13.2 - Prob. 17ECh. 13.2 - In each of Exercises 13.1813.23, we have provided...Ch. 13.2 - In each of Exercises 13.1813.23, we have provided...Ch. 13.2 - Prob. 20ECh. 13.2 - Prob. 21ECh. 13.2 - Prob. 22ECh. 13.2 - In each of Exercises 13.18-13.23, we have provided...Ch. 13.2 - In each of Exercises 13.24-13.33, apply the...Ch. 13.2 - In each of Exercises 13.24-13.3, apply the...Ch. 13.2 - In each of Exercises 13.24-13.33, apply the...Ch. 13.2 - Prob. 27ECh. 13.2 - In Each of Exercises 13.24-13.33, apply the...Ch. 13.2 - Prob. 29ECh. 13.2 - In each of Exercises 13.24-13.33, apply the...Ch. 13.2 - Prob. 31ECh. 13.2 - In each of Exercises 13.24-13.33, apply the...Ch. 13.2 - Prob. 33ECh. 13.2 - Prob. 34ECh. 13.2 - The chi-square goodness-of-fit test provides a...Ch. 13.3 - Identify the type of table that is used to group...Ch. 13.3 - What are the small boxes inside the heavy lines of...Ch. 13.3 - Suppose that bivariate data are to be grouped into...Ch. 13.3 - Identify three ways in which the total number of...Ch. 13.3 - Presidential Election. According to Dave Leip's...Ch. 13.3 - Prob. 41ECh. 13.3 - Prob. 42ECh. 13.3 - Prob. 43ECh. 13.3 - Prob. 44ECh. 13.3 - Prob. 45ECh. 13.3 - Prob. 46ECh. 13.3 - AIDS Cases. According to the Centers for Disease...Ch. 13.3 - Prob. 48ECh. 13.3 - Prob. 49ECh. 13.3 - Prob. 50ECh. 13.3 - Farms. The U.S. Department of Agriculture...Ch. 13.3 - Prob. 52ECh. 13.3 - AIDS Cases. Refer to Exercise 13.47. For AIDS case...Ch. 13.3 - Prob. 54ECh. 13.3 - Prob. 55ECh. 13.3 - Prob. 56ECh. 13.3 - In each of Exercises 13.57-13.59, use the...Ch. 13.3 - In each of Exercises 13.57-13.59, use the...Ch. 13.3 - In each of Exercises 13.57-13.59, use the...Ch. 13.3 - In the exercise, you are to consider two variables...Ch. 13.3 - Prob. 61ECh. 13.4 - To decide whether two variables of a population...Ch. 13.4 - Prob. 63ECh. 13.4 - Prob. 64ECh. 13.4 - Prob. 65ECh. 13.4 - Prob. 66ECh. 13.4 - Education and Salary. Studies have shown that a...Ch. 13.4 - Identify three techniques that can he tried as a...Ch. 13.4 - Prob. 69ECh. 13.4 - Prob. 70ECh. 13.4 - In each of Exercises 13.69-13.74, we have given...Ch. 13.4 - Prob. 72ECh. 13.4 - In each of Exercises 13.69-13.74, we have given...Ch. 13.4 - Prob. 74ECh. 13.4 - Prob. 75ECh. 13.4 - Prob. 76ECh. 13.4 - Prob. 77ECh. 13.4 - Prob. 78ECh. 13.4 - In Exercises13.79-13.86, use either the...Ch. 13.4 - In Exercises 13.79-13.86, use either the...Ch. 13.4 - Prob. 81ECh. 13.4 - In Exercises 13.7913.86, use either she critical...Ch. 13.4 - In Exercises 13.7913.86, use either she...Ch. 13.4 - Prob. 84ECh. 13.4 - Prob. 85ECh. 13.4 - Prob. 86ECh. 13.4 - Prob. 87ECh. 13.4 - In Exercises 13.7913.86, use either the...Ch. 13.4 - Prob. 89ECh. 13.4 - Prob. 90ECh. 13.4 - Prob. 91ECh. 13.4 - Prob. 92ECh. 13.5 - Prob. 93ECh. 13.5 - For what purpose is a chi-square homogeneity test...Ch. 13.5 - Prob. 95ECh. 13.5 - State the null and alternative hypotheses for a...Ch. 13.5 - Prob. 97ECh. 13.5 - Prob. 98ECh. 13.5 - Prob. 99ECh. 13.5 - A chi-square homogeneity test is to be conducted...Ch. 13.5 - Prob. 101ECh. 13.5 - In Exercises 13.101-13.106, use either the...Ch. 13.5 - In Exercises 13.101-13.106, use either the...Ch. 13.5 - Prob. 104ECh. 13.5 - Prob. 105ECh. 13.5 - Prob. 106ECh. 13.5 - In each of Exercises 13.107 and 13.108 a. use the...Ch. 13.5 - In each of Exercises 13.107 and 13.108, a. use the...Ch. 13 - How do you distinguish among the infinitely many...Ch. 13 - Prob. 2RPCh. 13 - Prob. 3RPCh. 13 - Explain why a chi-square goodness-of-fit test, a...Ch. 13 - Prob. 5RPCh. 13 - Rending the expected-frequency assumptions for a...Ch. 13 - Prob. 7RPCh. 13 - Suppose that you have bivariate data for an entire...Ch. 13 - Suppose that you have bivariate data for a sample...Ch. 13 - Prob. 10RPCh. 13 - Prob. 11RPCh. 13 - Prob. 12RPCh. 13 - Prob. 13RPCh. 13 - Presidents. Refer to Problem 12. a. Find the...Ch. 13 - Prob. 15RPCh. 13 - Prob. 16RPCh. 13 - Prob. 17RPCh. 13 - Prob. 18RPCh. 13 - Prob. 19RPCh. 13 - Income and Residence. The U.S. Census Bureau...Ch. 13 - Economy in Recession? The Quinnipiac University...Ch. 13 - Prob. 22RPCh. 13 - With holding Treatment. Several years ago. a poll...Ch. 13 - Recall from Chapter 1 (see page 34) that the Focus...Ch. 13 - At the beginning of this chapter, we presented a...
Knowledge Booster


Learn more about
Need a deep-dive on the concept behind this application? Look no further. Learn more about this topic, statistics and related others by exploring similar questions and additional content below.Similar questions
- PS 9 Two films are shown on screen A and screen B at a cinema each evening. The numbers of people viewing the films on 12 consecutive evenings are shown in the back-to-back stem-and-leaf diagram. Screen A (12) Screen B (12) 8 037 34 7 6 4 0 534 74 1645678 92 71689 Key: 116|4 represents 61 viewers for A and 64 viewers for B A second stem-and-leaf diagram (with rows of the same width as the previous diagram) is drawn showing the total number of people viewing films at the cinema on each of these 12 evenings. Find the least and greatest possible number of rows that this second diagram could have. TIP On the evening when 30 people viewed films on screen A, there could have been as few as 37 or as many as 79 people viewing films on screen B.arrow_forwardQ.2.4 There are twelve (12) teams participating in a pub quiz. What is the probability of correctly predicting the top three teams at the end of the competition, in the correct order? Give your final answer as a fraction in its simplest form.arrow_forwardThe table below indicates the number of years of experience of a sample of employees who work on a particular production line and the corresponding number of units of a good that each employee produced last month. Years of Experience (x) Number of Goods (y) 11 63 5 57 1 48 4 54 5 45 3 51 Q.1.1 By completing the table below and then applying the relevant formulae, determine the line of best fit for this bivariate data set. Do NOT change the units for the variables. X y X2 xy Ex= Ey= EX2 EXY= Q.1.2 Estimate the number of units of the good that would have been produced last month by an employee with 8 years of experience. Q.1.3 Using your calculator, determine the coefficient of correlation for the data set. Interpret your answer. Q.1.4 Compute the coefficient of determination for the data set. Interpret your answer.arrow_forward
- Can you answer this question for mearrow_forwardTechniques QUAT6221 2025 PT B... TM Tabudi Maphoru Activities Assessments Class Progress lIE Library • Help v The table below shows the prices (R) and quantities (kg) of rice, meat and potatoes items bought during 2013 and 2014: 2013 2014 P1Qo PoQo Q1Po P1Q1 Price Ро Quantity Qo Price P1 Quantity Q1 Rice 7 80 6 70 480 560 490 420 Meat 30 50 35 60 1 750 1 500 1 800 2 100 Potatoes 3 100 3 100 300 300 300 300 TOTAL 40 230 44 230 2 530 2 360 2 590 2 820 Instructions: 1 Corall dawn to tha bottom of thir ceraan urina se se tha haca nariad in archerca antarand cubmit Q Search ENG US 口X 2025/05arrow_forwardThe table below indicates the number of years of experience of a sample of employees who work on a particular production line and the corresponding number of units of a good that each employee produced last month. Years of Experience (x) Number of Goods (y) 11 63 5 57 1 48 4 54 45 3 51 Q.1.1 By completing the table below and then applying the relevant formulae, determine the line of best fit for this bivariate data set. Do NOT change the units for the variables. X y X2 xy Ex= Ey= EX2 EXY= Q.1.2 Estimate the number of units of the good that would have been produced last month by an employee with 8 years of experience. Q.1.3 Using your calculator, determine the coefficient of correlation for the data set. Interpret your answer. Q.1.4 Compute the coefficient of determination for the data set. Interpret your answer.arrow_forward
- Q.3.2 A sample of consumers was asked to name their favourite fruit. The results regarding the popularity of the different fruits are given in the following table. Type of Fruit Number of Consumers Banana 25 Apple 20 Orange 5 TOTAL 50 Draw a bar chart to graphically illustrate the results given in the table.arrow_forwardQ.2.3 The probability that a randomly selected employee of Company Z is female is 0.75. The probability that an employee of the same company works in the Production department, given that the employee is female, is 0.25. What is the probability that a randomly selected employee of the company will be female and will work in the Production department? Q.2.4 There are twelve (12) teams participating in a pub quiz. What is the probability of correctly predicting the top three teams at the end of the competition, in the correct order? Give your final answer as a fraction in its simplest form.arrow_forwardQ.2.1 A bag contains 13 red and 9 green marbles. You are asked to select two (2) marbles from the bag. The first marble selected will not be placed back into the bag. Q.2.1.1 Construct a probability tree to indicate the various possible outcomes and their probabilities (as fractions). Q.2.1.2 What is the probability that the two selected marbles will be the same colour? Q.2.2 The following contingency table gives the results of a sample survey of South African male and female respondents with regard to their preferred brand of sports watch: PREFERRED BRAND OF SPORTS WATCH Samsung Apple Garmin TOTAL No. of Females 30 100 40 170 No. of Males 75 125 80 280 TOTAL 105 225 120 450 Q.2.2.1 What is the probability of randomly selecting a respondent from the sample who prefers Garmin? Q.2.2.2 What is the probability of randomly selecting a respondent from the sample who is not female? Q.2.2.3 What is the probability of randomly…arrow_forward
- Test the claim that a student's pulse rate is different when taking a quiz than attending a regular class. The mean pulse rate difference is 2.7 with 10 students. Use a significance level of 0.005. Pulse rate difference(Quiz - Lecture) 2 -1 5 -8 1 20 15 -4 9 -12arrow_forwardThe following ordered data list shows the data speeds for cell phones used by a telephone company at an airport: A. Calculate the Measures of Central Tendency from the ungrouped data list. B. Group the data in an appropriate frequency table. C. Calculate the Measures of Central Tendency using the table in point B. D. Are there differences in the measurements obtained in A and C? Why (give at least one justified reason)? I leave the answers to A and B to resolve the remaining two. 0.8 1.4 1.8 1.9 3.2 3.6 4.5 4.5 4.6 6.2 6.5 7.7 7.9 9.9 10.2 10.3 10.9 11.1 11.1 11.6 11.8 12.0 13.1 13.5 13.7 14.1 14.2 14.7 15.0 15.1 15.5 15.8 16.0 17.5 18.2 20.2 21.1 21.5 22.2 22.4 23.1 24.5 25.7 28.5 34.6 38.5 43.0 55.6 71.3 77.8 A. Measures of Central Tendency We are to calculate: Mean, Median, Mode The data (already ordered) is: 0.8, 1.4, 1.8, 1.9, 3.2, 3.6, 4.5, 4.5, 4.6, 6.2, 6.5, 7.7, 7.9, 9.9, 10.2, 10.3, 10.9, 11.1, 11.1, 11.6, 11.8, 12.0, 13.1, 13.5, 13.7, 14.1, 14.2, 14.7, 15.0, 15.1, 15.5,…arrow_forwardPEER REPLY 1: Choose a classmate's Main Post. 1. Indicate a range of values for the independent variable (x) that is reasonable based on the data provided. 2. Explain what the predicted range of dependent values should be based on the range of independent values.arrow_forward
arrow_back_ios
SEE MORE QUESTIONS
arrow_forward_ios
Recommended textbooks for you
 Glencoe Algebra 1, Student Edition, 9780079039897...AlgebraISBN:9780079039897Author:CarterPublisher:McGraw Hill
 Holt Mcdougal Larson Pre-algebra: Student Edition...AlgebraISBN:9780547587776Author:HOLT MCDOUGALPublisher:HOLT MCDOUGAL
Glencoe Algebra 1, Student Edition, 9780079039897...
Algebra
ISBN:9780079039897
Author:Carter
Publisher:McGraw Hill
Holt Mcdougal Larson Pre-algebra: Student Edition...
Algebra
ISBN:9780547587776
Author:HOLT MCDOUGAL
Publisher:HOLT MCDOUGAL
How to make Frequency Distribution Table / Tally Marks and Frequency Distribution Table; Author: Reenu Math;https://www.youtube.com/watch?v=i_A6RiE8tLE;License: Standard YouTube License, CC-BY
Frequency distribution table in statistics; Author: Math and Science;https://www.youtube.com/watch?v=T7KYO76DoOE;License: Standard YouTube License, CC-BY
Frequency Distribution Table for Grouped/Continuous data | Math Dot Com; Author: Maths dotcom;https://www.youtube.com/watch?v=ErnccbXQOPY;License: Standard Youtube License