
Statistics: The Art and Science of Learning From Data, Books a la Carte Edition (4th Edition)
4th Edition
ISBN: 9780133860825
Author: Alan Agresti, Christine A. Franklin, Bernhard Klingenberg
Publisher: PEARSON
expand_more
expand_more
format_list_bulleted
Videos
Textbook Question
Chapter 13.3, Problem 21PB
Study time help GPA? Refer to the previous exercise.
- a. Report and interpret the P-value for testing the hypothesis that the population slope coefficient for study time equals 0.
- b. Find a 95% confidence interval for the true slope for study time. Explain how the result is in accord with the result of the test in part a.
- c. Does the result in part a imply that in the corresponding population, study time has no association with college GPA? Explain. (Hint: What is the impact of also having HSGPA in the model?)
13.20 Predicting GPA For the 59 observations in the Georgia Student Survey data file on the book’s website, the result of regressing college GPA on high school GPA and study time follows.
Regression Equation
CGPA = 1.126 + 0.643 HSGPA + 0.0078 Studytime
Coefficients
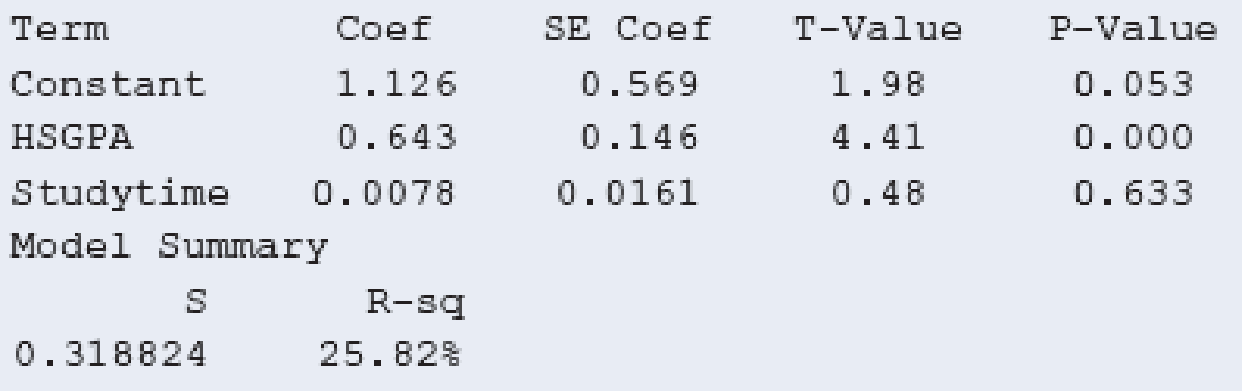
- a. Explain in nontechnical terms what it means if the population slope coefficient for high school GPA equals 0.
- b. Show all steps for testing the hypothesis that this slope equals 0.
Expert Solution & Answer
Want to see the full answer?
Check out a sample textbook solution
Students have asked these similar questions
A marketing agency wants to determine whether different advertising platforms generate significantly different levels of customer engagement. The agency measures the average number of daily clicks on ads for three platforms: Social Media, Search Engines, and Email Campaigns. The agency collects data on daily clicks for each platform over a 10-day period and wants to test whether there is a statistically significant difference in the mean number of daily clicks among these platforms. Conduct ANOVA test.
You can provide your answer by inserting a text box and the answer must include: also please provide a step by on getting the answers in excel
Null hypothesis,
Alternative hypothesis,
Show answer (output table/summary table), and
Conclusion based on the P value.
A company found that the daily sales revenue of its flagship product follows a normal distribution with a mean of $4500 and a standard deviation of $450. The company defines a "high-sales day" that is, any day with sales exceeding $4800. please provide a step by step on how to get the answers
Q: What percentage of days can the company expect to have "high-sales days" or sales greater than $4800?
Q: What is the sales revenue threshold for the bottom 10% of days? (please note that 10% refers to the probability/area under bell curve towards the lower tail of bell curve)
Provide answers in the yellow cells
Business Discuss
Chapter 13 Solutions
Statistics: The Art and Science of Learning From Data, Books a la Carte Edition (4th Edition)
Ch. 13.1 - Predicting weight For a study of female college...Ch. 13.1 - Prob. 2PBCh. 13.1 - Predicting college GPA For all students at Walden...Ch. 13.1 - Prob. 4PBCh. 13.1 - Does more education cause more crime? The FL Crime...Ch. 13.1 - Crime rate and income Refer to the previous...Ch. 13.1 - The economics of golf The earnings of a PGA Tour...Ch. 13.1 - Prob. 8PBCh. 13.1 - Controlling can have no effect Suppose that the...Ch. 13.1 - House selling prices Using software with the House...
Ch. 13.1 - Used cars The following data (also available from...Ch. 13.2 - Predicting sports attendance Keeneland Racetrack...Ch. 13.2 - Predicting weight Lets use multiple regression to...Ch. 13.2 - Prob. 14PBCh. 13.2 - Price of used cars For the 19 used cars listed in...Ch. 13.2 - Prob. 16PBCh. 13.2 - Softball data For the Softball data set on the...Ch. 13.2 - Slopes, correlations, and units In Example 2 on y...Ch. 13.2 - Predicting college GPA Using software with the...Ch. 13.3 - Predicting GPA For the 59 observations in the...Ch. 13.3 - Study time help GPA? Refer to the previous...Ch. 13.3 - Variability in college GPA Refer to the previous...Ch. 13.3 - Does leg press help predict body strength? Chapter...Ch. 13.3 - Prob. 24PBCh. 13.3 - Interpret strength variability Refer to the...Ch. 13.3 - Any predictive power? Refer to the previous three...Ch. 13.3 - Predicting pizza revenue Aunt Ermas Pizza...Ch. 13.3 - Prob. 28PBCh. 13.3 - Mental health again Refer to the previous...Ch. 13.3 - Prob. 30PBCh. 13.3 - House prices Use software to do further analyses...Ch. 13.4 - Body weight residuals Examples 47 used multiple...Ch. 13.4 - Strength residuals In Chapter 12, we analyzed...Ch. 13.4 - Prob. 34PBCh. 13.4 - Nonlinear effects of age Suppose you fit a...Ch. 13.4 - Prob. 36PBCh. 13.4 - Why inspect residuals? When we use multiple...Ch. 13.4 - College athletes The College Athletes data set on...Ch. 13.4 - House prices Use software with the House Selling...Ch. 13.4 - Prob. 40PBCh. 13.5 - U.S. and foreign used cars Refer to the used car...Ch. 13.5 - Prob. 42PBCh. 13.5 - Predict using house size and condition For the...Ch. 13.5 - Quality and productivity The table shows data from...Ch. 13.5 - Predicting hamburger sales A chain restaurant that...Ch. 13.5 - Prob. 46PBCh. 13.5 - House size and garage interact? Refer to the...Ch. 13.5 - Prob. 48PBCh. 13.5 - Comparing sales You own a gift shop that has a...Ch. 13.6 - Prob. 50PBCh. 13.6 - Prob. 51PBCh. 13.6 - Prob. 52PBCh. 13.6 - Prob. 53PBCh. 13.6 - Prob. 54PBCh. 13.6 - Prob. 55PBCh. 13.6 - Prob. 56PBCh. 13.6 - Prob. 57PBCh. 13.6 - Prob. 58PBCh. 13.6 - Prob. 59PBCh. 13 - House prices This chapter has considered many...Ch. 13 - Prob. 61CPCh. 13 - Prob. 62CPCh. 13 - Prob. 63CPCh. 13 - Prob. 64CPCh. 13 - Prob. 65CPCh. 13 - Prob. 66CPCh. 13 - Prob. 67CPCh. 13 - Prob. 68CPCh. 13 - Prob. 69CPCh. 13 - AIDS and AZT In a study (reported in the New York...Ch. 13 - Factors affecting first home purchase The table...Ch. 13 - Unemployment and GDP Refer to Exercise 13.67. When...Ch. 13 - Prob. 75CPCh. 13 - Prob. 76CPCh. 13 - Prob. 77CPCh. 13 - Prob. 78CPCh. 13 - Prob. 79CPCh. 13 - True or false: Slopes For data on y = college GPA,...Ch. 13 - Prob. 81CPCh. 13 - Lurking variable Give an example of three...Ch. 13 - Prob. 83CPCh. 13 - Prob. 84CPCh. 13 - Prob. 85CPCh. 13 - Logistic versus linear For binary response...Ch. 13 - Prob. 87CPCh. 13 - Prob. 88CPCh. 13 - Prob. 89CPCh. 13 - Prob. 90CPCh. 13 - Prob. 91CPCh. 13 - Prob. 92CPCh. 13 - Prob. 93CP
Knowledge Booster


Learn more about
Need a deep-dive on the concept behind this application? Look no further. Learn more about this topic, statistics and related others by exploring similar questions and additional content below.Similar questions
- The following data represent total ventilation measured in liters of air per minute per square meter of body area for two independent (and randomly chosen) samples. Analyze these data using the appropriate non-parametric hypothesis testarrow_forwardeach column represents before & after measurements on the same individual. Analyze with the appropriate non-parametric hypothesis test for a paired design.arrow_forwardShould you be confident in applying your regression equation to estimate the heart rate of a python at 35°C? Why or why not?arrow_forward
- Given your fitted regression line, what would be the residual for snake #5 (10 C)?arrow_forwardCalculate the 95% confidence interval around your estimate of r using Fisher’s z-transformation. In your final answer, make sure to back-transform to the original units.arrow_forwardCalculate Pearson’s correlation coefficient (r) between temperature and heart rate.arrow_forward
arrow_back_ios
SEE MORE QUESTIONS
arrow_forward_ios
Recommended textbooks for you
 Glencoe Algebra 1, Student Edition, 9780079039897...AlgebraISBN:9780079039897Author:CarterPublisher:McGraw Hill
 Big Ideas Math A Bridge To Success Algebra 1: Stu...AlgebraISBN:9781680331141Author:HOUGHTON MIFFLIN HARCOURTPublisher:Houghton Mifflin Harcourt
Glencoe Algebra 1, Student Edition, 9780079039897...
Algebra
ISBN:9780079039897
Author:Carter
Publisher:McGraw Hill
Big Ideas Math A Bridge To Success Algebra 1: Stu...
Algebra
ISBN:9781680331141
Author:HOUGHTON MIFFLIN HARCOURT
Publisher:Houghton Mifflin Harcourt
Hypothesis Testing using Confidence Interval Approach; Author: BUM2413 Applied Statistics UMP;https://www.youtube.com/watch?v=Hq1l3e9pLyY;License: Standard YouTube License, CC-BY
Hypothesis Testing - Difference of Two Means - Student's -Distribution & Normal Distribution; Author: The Organic Chemistry Tutor;https://www.youtube.com/watch?v=UcZwyzwWU7o;License: Standard Youtube License