Elementary Statistics (13th Edition)
13th Edition
ISBN: 9780134464244
Author: Triola
Publisher: PEARSON
expand_more
expand_more
format_list_bulleted
Videos
Textbook Question
Chapter 13, Problem 7RE
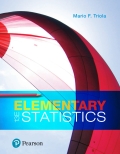
Using Nonparametric Tests. In Exercises 1–10, use a 0.05 significance level with the indicated test. If no particular test is specified, use the appropriate nonparametric test from this chapter.
7. Old Faithful Listed below are time intervals (min) between eruptions of the Old Faithful geyser. The “recent” times are within the past few years, and the “past” times are from 1995. Test the claim that the two samples are from populations with the same
Expert Solution & Answer
Want to see the full answer?
Check out a sample textbook solution
Students have asked these similar questions
Business
What is the solution and answer to question?
To: [Boss's Name]
From: Nathaniel D Sain
Date: 4/5/2025
Subject: Decision Analysis for Business Scenario
Introduction to the Business Scenario
Our delivery services business has been experiencing steady growth, leading to an
increased demand for faster and more efficient deliveries. To meet this demand,
we must decide on the best strategy to expand our fleet. The three possible
alternatives under consideration are purchasing new delivery vehicles, leasing
vehicles, or partnering with third-party drivers. The decision must account for
various external factors, including fuel price fluctuations, demand stability, and
competition growth, which we categorize as the states of nature. Each alternative
presents unique advantages and challenges, and our goal is to select the most
viable option using a structured decision-making approach.
Alternatives and States of Nature
The three alternatives for fleet expansion were chosen based on their cost
implications, operational efficiency, and…
Chapter 13 Solutions
Elementary Statistics (13th Edition)
Ch. 13.2 - Prob. 1BSCCh. 13.2 - Prob. 2BSCCh. 13.2 - Contradicting H1 An important step in conducting...Ch. 13.2 - Efficiency of the Sign Test Refer to Table 13-2 on...Ch. 13.2 - Matched Pairs. In Exercises 58, use the sign test...Ch. 13.2 - Matched Pairs. In Exercises 58, use the sign test...Ch. 13.2 - Matched Pairs. In Exercises 58, use the sign test...Ch. 13.2 - Matched Pairs. In Exercises 58, use the sign test...Ch. 13.2 - Nominal Data. In Exercises 912, use the sign test...Ch. 13.2 - Nominal Data. In Exercises 912, use the sign test...
Ch. 13.2 - Nominal Data. In Exercises 912, use the sign test...Ch. 13.2 - Nominal Data. In Exercises 912, use the sign test...Ch. 13.2 - Appendix B Data Sets. In Exercises 1316, refer to...Ch. 13.2 - Appendix B Data Sets. In Exercises 1316, refer to...Ch. 13.2 - Appendix B Data Sets. In Exercises 1316, refer to...Ch. 13.2 - Appendix B Data Sets. In Exercises 1316, refer to...Ch. 13.2 - Procedures for Handling Ties In the sign lest...Ch. 13.2 - Finding Critical Values Table A-7 lists critical...Ch. 13.3 - Wilcoxon Signed-Ranks Test for Body Temperatures...Ch. 13.3 - Prob. 2BSCCh. 13.3 - Prob. 3BSCCh. 13.3 - Prob. 4BSCCh. 13.3 - Using the Wilcoxon Signed-Ranks Test. In Exercises...Ch. 13.3 - Using the Wilcoxon Signed-Ranks Test. In Exercises...Ch. 13.3 - Using the Wilcoxon Signed-Ranks Test. In Exercises...Ch. 13.3 - Using the Wilcoxon Signed-Ranks Test. In Exercises...Ch. 13.3 - Prob. 9BSCCh. 13.3 - Prob. 10BSCCh. 13.3 - Prob. 11BSCCh. 13.3 - Prob. 12BSCCh. 13.3 - Rank Sums Exercise 12 uses Data Set 23 Old...Ch. 13.4 - Prob. 1BSCCh. 13.4 - Rank Sum After ranking the combined list of...Ch. 13.4 - Prob. 3BSCCh. 13.4 - Prob. 4BSCCh. 13.4 - Wilcoxon Rank-Sum Test. In Exercises 58, use the...Ch. 13.4 - Wilcoxon Rank-Sum Test. In Exercises 58, use the...Ch. 13.4 - Wilcoxon Rank-Sum Test. In Exercises 58, use the...Ch. 13.4 - Wilcoxon Rank-Sum Test. In Exercises 58, use the...Ch. 13.4 - Prob. 9BSCCh. 13.4 - Appendix B Data Sets. In Exercises 912, refer to...Ch. 13.4 - Appendix B Data Sets. In Exercises 912, refer to...Ch. 13.4 - Appendix B Data Sets. In Exercises 912, refer to...Ch. 13.4 - Prob. 13BBCh. 13.4 - Finding Critical Values Assume that we have two...Ch. 13.5 - Prob. 1BSCCh. 13.5 - Requirements Assume that we want to use the data...Ch. 13.5 - Notation For the data given in Exercise 1,...Ch. 13.5 - Efficiency Refer to Table 13-2 on page 600 and...Ch. 13.5 - Prob. 5BSCCh. 13.5 - Prob. 6BSCCh. 13.5 - Prob. 7BSCCh. 13.5 - Prob. 8BSCCh. 13.5 - Appendix B Data Sets. In Exercises 912, use the...Ch. 13.5 - Prob. 10BSCCh. 13.5 - Appendix B Data Sets. In Exercises 912, use the...Ch. 13.5 - Appendix B Data Sets. In Exercises 912, use the...Ch. 13.5 - Correcting the H Test Statistic for Ties In using...Ch. 13.6 - Regression If the methods of this section are used...Ch. 13.6 - Level of Measurement Which of the levels of...Ch. 13.6 - Notation What do r, rs , and ps denote? Why is the...Ch. 13.6 - Prob. 4BSCCh. 13.6 - In Exercises 5 and 6, use the scatterplot to find...Ch. 13.6 - In Exercises 5 and 6, use the scatterplot to find...Ch. 13.6 - Testing for Rank Correlation. In Exercises 712,...Ch. 13.6 - Prob. 8BSCCh. 13.6 - Testing for Rank Correlation. In Exercises 712,...Ch. 13.6 - Testing for Rank Correlation. In Exercises 712,...Ch. 13.6 - Prob. 11BSCCh. 13.6 - Testing for Rank Correlation. In Exercises 712,...Ch. 13.6 - Prob. 13BSCCh. 13.6 - Appendix B Data Sets. In Exercises 1316, use the...Ch. 13.6 - Appendix B Data Sets. In Exercises 1316, use the...Ch. 13.6 - Prob. 16BSCCh. 13.6 - Prob. 17BBCh. 13.7 - In Exercises 14, use the following sequence of...Ch. 13.7 - Prob. 2BSCCh. 13.7 - Prob. 3BSCCh. 13.7 - Prob. 4BSCCh. 13.7 - Using the Runs Test for Randomness. In Exercises...Ch. 13.7 - Prob. 6BSCCh. 13.7 - Prob. 7BSCCh. 13.7 - Using the Runs Test for Randomness. In Exercises...Ch. 13.7 - Prob. 9BSCCh. 13.7 - Prob. 10BSCCh. 13.7 - Runs Test with Large Samples. In Exercises 912,...Ch. 13.7 - Prob. 12BSCCh. 13 - Prob. 1CQQCh. 13 - Prob. 2CQQCh. 13 - Prob. 3CQQCh. 13 - Prob. 4CQQCh. 13 - Prob. 5CQQCh. 13 - Prob. 6CQQCh. 13 - Prob. 7CQQCh. 13 - Prob. 8CQQCh. 13 - Prob. 9CQQCh. 13 - Which Test? Three different judges give the same...Ch. 13 - Prob. 1RECh. 13 - Using Nonparametric Tests. In Exercises 110, use a...Ch. 13 - Prob. 3RECh. 13 - Prob. 4RECh. 13 - Prob. 5RECh. 13 - Prob. 6RECh. 13 - Using Nonparametric Tests. In Exercises 110, use a...Ch. 13 - Prob. 8RECh. 13 - Using Nonparametric Tests. In Exercises 1-10, use...Ch. 13 - Prob. 10RECh. 13 - Prob. 1CRECh. 13 - Prob. 2CRECh. 13 - In Exercises 13, use the data listed below. The...Ch. 13 - Prob. 4CRECh. 13 - Prob. 5CRECh. 13 - Prob. 6CRECh. 13 - Prob. 7CRECh. 13 - Prob. 8CRECh. 13 - Fear of Heights Among readers of a USA Today...Ch. 13 - Cell Phones and Crashes: Analyzing Newspaper...Ch. 13 - Prob. 1TPCh. 13 - Prob. 1FDD
Knowledge Booster


Learn more about
Need a deep-dive on the concept behind this application? Look no further. Learn more about this topic, statistics and related others by exploring similar questions and additional content below.Similar questions
- The following ordered data list shows the data speeds for cell phones used by a telephone company at an airport: A. Calculate the Measures of Central Tendency from the ungrouped data list. B. Group the data in an appropriate frequency table. C. Calculate the Measures of Central Tendency using the table in point B. 0.8 1.4 1.8 1.9 3.2 3.6 4.5 4.5 4.6 6.2 6.5 7.7 7.9 9.9 10.2 10.3 10.9 11.1 11.1 11.6 11.8 12.0 13.1 13.5 13.7 14.1 14.2 14.7 15.0 15.1 15.5 15.8 16.0 17.5 18.2 20.2 21.1 21.5 22.2 22.4 23.1 24.5 25.7 28.5 34.6 38.5 43.0 55.6 71.3 77.8arrow_forwardII Consider the following data matrix X: X1 X2 0.5 0.4 0.2 0.5 0.5 0.5 10.3 10 10.1 10.4 10.1 10.5 What will the resulting clusters be when using the k-Means method with k = 2. In your own words, explain why this result is indeed expected, i.e. why this clustering minimises the ESS map.arrow_forwardwhy the answer is 3 and 10?arrow_forward
- PS 9 Two films are shown on screen A and screen B at a cinema each evening. The numbers of people viewing the films on 12 consecutive evenings are shown in the back-to-back stem-and-leaf diagram. Screen A (12) Screen B (12) 8 037 34 7 6 4 0 534 74 1645678 92 71689 Key: 116|4 represents 61 viewers for A and 64 viewers for B A second stem-and-leaf diagram (with rows of the same width as the previous diagram) is drawn showing the total number of people viewing films at the cinema on each of these 12 evenings. Find the least and greatest possible number of rows that this second diagram could have. TIP On the evening when 30 people viewed films on screen A, there could have been as few as 37 or as many as 79 people viewing films on screen B.arrow_forwardQ.2.4 There are twelve (12) teams participating in a pub quiz. What is the probability of correctly predicting the top three teams at the end of the competition, in the correct order? Give your final answer as a fraction in its simplest form.arrow_forwardThe table below indicates the number of years of experience of a sample of employees who work on a particular production line and the corresponding number of units of a good that each employee produced last month. Years of Experience (x) Number of Goods (y) 11 63 5 57 1 48 4 54 5 45 3 51 Q.1.1 By completing the table below and then applying the relevant formulae, determine the line of best fit for this bivariate data set. Do NOT change the units for the variables. X y X2 xy Ex= Ey= EX2 EXY= Q.1.2 Estimate the number of units of the good that would have been produced last month by an employee with 8 years of experience. Q.1.3 Using your calculator, determine the coefficient of correlation for the data set. Interpret your answer. Q.1.4 Compute the coefficient of determination for the data set. Interpret your answer.arrow_forward
- Can you answer this question for mearrow_forwardTechniques QUAT6221 2025 PT B... TM Tabudi Maphoru Activities Assessments Class Progress lIE Library • Help v The table below shows the prices (R) and quantities (kg) of rice, meat and potatoes items bought during 2013 and 2014: 2013 2014 P1Qo PoQo Q1Po P1Q1 Price Ро Quantity Qo Price P1 Quantity Q1 Rice 7 80 6 70 480 560 490 420 Meat 30 50 35 60 1 750 1 500 1 800 2 100 Potatoes 3 100 3 100 300 300 300 300 TOTAL 40 230 44 230 2 530 2 360 2 590 2 820 Instructions: 1 Corall dawn to tha bottom of thir ceraan urina se se tha haca nariad in archerca antarand cubmit Q Search ENG US 口X 2025/05arrow_forwardThe table below indicates the number of years of experience of a sample of employees who work on a particular production line and the corresponding number of units of a good that each employee produced last month. Years of Experience (x) Number of Goods (y) 11 63 5 57 1 48 4 54 45 3 51 Q.1.1 By completing the table below and then applying the relevant formulae, determine the line of best fit for this bivariate data set. Do NOT change the units for the variables. X y X2 xy Ex= Ey= EX2 EXY= Q.1.2 Estimate the number of units of the good that would have been produced last month by an employee with 8 years of experience. Q.1.3 Using your calculator, determine the coefficient of correlation for the data set. Interpret your answer. Q.1.4 Compute the coefficient of determination for the data set. Interpret your answer.arrow_forward
arrow_back_ios
SEE MORE QUESTIONS
arrow_forward_ios
Recommended textbooks for you
 Glencoe Algebra 1, Student Edition, 9780079039897...AlgebraISBN:9780079039897Author:CarterPublisher:McGraw Hill
 College Algebra (MindTap Course List)AlgebraISBN:9781305652231Author:R. David Gustafson, Jeff HughesPublisher:Cengage Learning
Glencoe Algebra 1, Student Edition, 9780079039897...
Algebra
ISBN:9780079039897
Author:Carter
Publisher:McGraw Hill
College Algebra (MindTap Course List)
Algebra
ISBN:9781305652231
Author:R. David Gustafson, Jeff Hughes
Publisher:Cengage Learning
Hypothesis Testing using Confidence Interval Approach; Author: BUM2413 Applied Statistics UMP;https://www.youtube.com/watch?v=Hq1l3e9pLyY;License: Standard YouTube License, CC-BY
Hypothesis Testing - Difference of Two Means - Student's -Distribution & Normal Distribution; Author: The Organic Chemistry Tutor;https://www.youtube.com/watch?v=UcZwyzwWU7o;License: Standard Youtube License