
Concept explainers
Videos
Factors affecting first home purchase The table summarizes results of a logistic regression model for predictions about first home purchase by young married households. The response variable is whether the subject owns a home (1 = yes, 0 = no). The explanatory variables are husband’s income, wife’s income (each in ten-thousands of dollars), the number of years the respondent has been married, the number of children aged 0–17 in the household, and an indicator variable that equals 1 if the subject’s parents owned a home in the last year the subject lived in the parental home.
- a. Explain why, other things being fixed, the
probability of home ownership increases with husband’s earnings, wife’s earnings, the number of children, and parents’ home ownership. - b. From the table, explain why the number of years married seems to show little evidence of an effect, given the other variables in the model.
Results of logistic regression for probability of home ownership
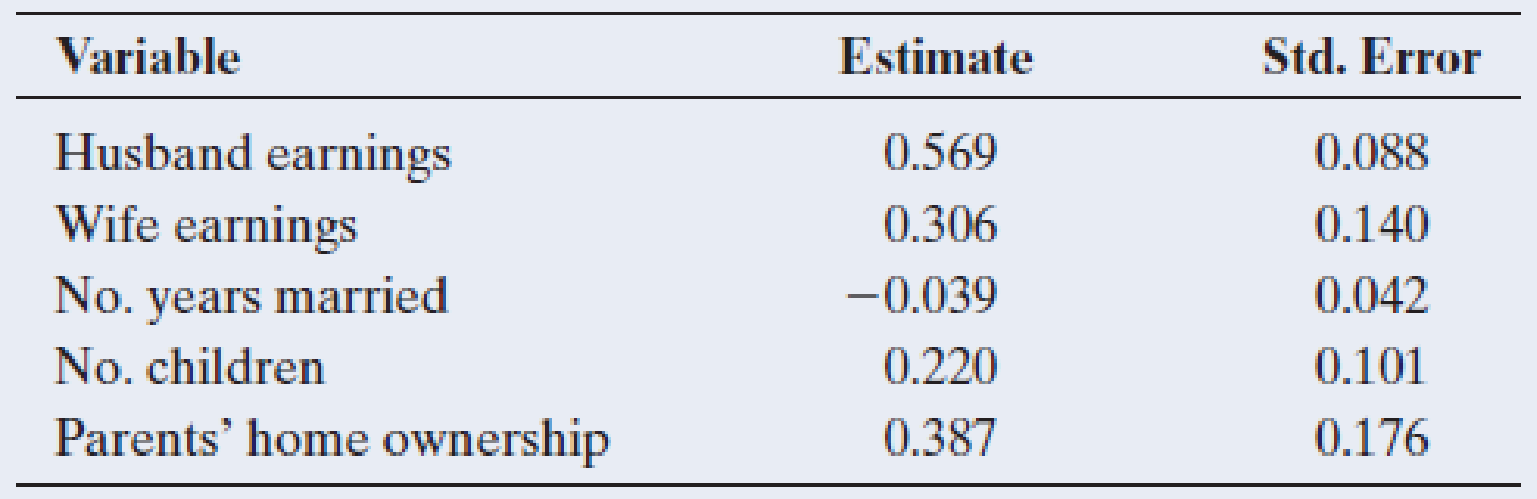
Source: Data from J. Henretta, “Family Transitions, Housing Market Context, and First Home Purchase,” Social Forces, vol. 66, 1987, pp. 520–536.
Want to see the full answer?
Check out a sample textbook solution
Chapter 13 Solutions
EP STATISTICS:ART+SCI...-MYLABSTATISTIC


- A company found that the daily sales revenue of its flagship product follows a normal distribution with a mean of $4500 and a standard deviation of $450. The company defines a "high-sales day" that is, any day with sales exceeding $4800. please provide a step by step on how to get the answers in excel Q: What percentage of days can the company expect to have "high-sales days" or sales greater than $4800? Q: What is the sales revenue threshold for the bottom 10% of days? (please note that 10% refers to the probability/area under bell curve towards the lower tail of bell curve) Provide answers in the yellow cellsarrow_forwardFind the critical value for a left-tailed test using the F distribution with a 0.025, degrees of freedom in the numerator=12, and degrees of freedom in the denominator = 50. A portion of the table of critical values of the F-distribution is provided. Click the icon to view the partial table of critical values of the F-distribution. What is the critical value? (Round to two decimal places as needed.)arrow_forwardA retail store manager claims that the average daily sales of the store are $1,500. You aim to test whether the actual average daily sales differ significantly from this claimed value. You can provide your answer by inserting a text box and the answer must include: Null hypothesis, Alternative hypothesis, Show answer (output table/summary table), and Conclusion based on the P value. Showing the calculation is a must. If calculation is missing,so please provide a step by step on the answers Numerical answers in the yellow cellsarrow_forward
 Glencoe Algebra 1, Student Edition, 9780079039897...AlgebraISBN:9780079039897Author:CarterPublisher:McGraw Hill
 Big Ideas Math A Bridge To Success Algebra 1: Stu...AlgebraISBN:9781680331141Author:HOUGHTON MIFFLIN HARCOURTPublisher:Houghton Mifflin Harcourt
 Linear Algebra: A Modern IntroductionAlgebraISBN:9781285463247Author:David PoolePublisher:Cengage Learning
 Trigonometry (MindTap Course List)TrigonometryISBN:9781337278461Author:Ron LarsonPublisher:Cengage Learning