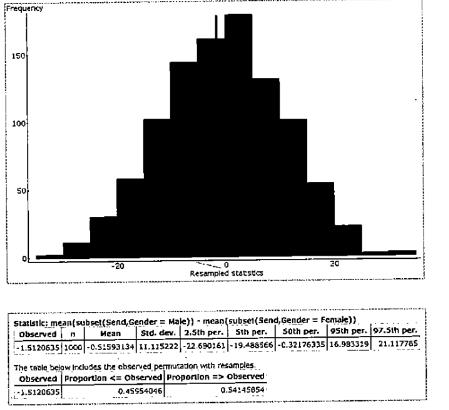
Resampling Texts Using the data from Exercise 13.25, we used a randomization test to find out whether the typical number of texts sent by men is less than the typical number sent by woman. The histogram shows the results of 1000 randomizations of the data. In each randomization, we found the mean difference brines two groups that were randomly selected from the combined group of data: the combined data for the men and women. Note that. just as you would expect under the null hypothesis, the distribution is centered at about 0. The observed difference in means (men minus women) is shown by the red vertical line. The sample mean for women was 28.52. and the sample mean for men was 27.01. The p-value for the one-sided hypothesis that women send more texts is shown in the numerical output. Does this show that women tend to send significantly more text messages than men? Use a significance level of 0.05 and assume the sample is randomly selected from the population. Comment on both the histogram and the table of output.
Resampling Texts Using the data from Exercise 13.25, we used a randomization test to find out whether the typical number of texts sent by men is less than the typical number sent by woman. The histogram shows the results of 1000 randomizations of the data. In each randomization, we found the mean difference brines two groups that were randomly selected from the combined group of data: the combined data for the men and women. Note that. just as you would expect under the null hypothesis, the distribution is centered at about 0. The observed difference in means (men minus women) is shown by the red vertical line. The sample mean for women was 28.52. and the sample mean for men was 27.01. The p-value for the one-sided hypothesis that women send more texts is shown in the numerical output. Does this show that women tend to send significantly more text messages than men? Use a significance level of 0.05 and assume the sample is randomly selected from the population. Comment on both the histogram and the table of output.
Solution Summary: The author determines whether there is a significant difference between mean number of messages sent by women and men at 5% level of significance.
Resampling Texts Using the data from Exercise 13.25, we used a randomization test to find out whether the typical number of texts sent by men is less than the typical number sent by woman. The histogram shows the results of 1000 randomizations of the data. In each randomization, we found the mean difference brines two groups that were randomly selected from the combined group of data: the combined data for the men and women. Note that. just as you would expect under the null hypothesis, the distribution is centered at about 0. The observed difference in means (men minus women) is shown by the red vertical line. The sample mean for women was 28.52. and the sample mean for men was 27.01. The p-value for the one-sided hypothesis that women send more texts is shown in the numerical output. Does this show that women tend to send significantly more text messages than men? Use a significance level of 0.05 and assume the sample is randomly selected from the population. Comment on both the histogram and the table of output.
Definition Definition Number of subjects or observations included in a study. A large sample size typically provides more reliable results and better representation of the population. As sample size and width of confidence interval are inversely related, if the sample size is increased, the width of the confidence interval decreases.
NC Current Students - North Ce X | NC Canvas Login Links - North ( X
Final Exam Comprehensive x Cengage Learning
x
WASTAT - Final Exam - STAT
→
C
webassign.net/web/Student/Assignment-Responses/submit?dep=36055360&tags=autosave#question3659890_9
Part (b)
Draw a scatter plot of the ordered pairs.
N
Life
Expectancy
Life
Expectancy
80
70
600
50
40
30
20
10
Year of
1950
1970 1990
2010 Birth
O
Life
Expectancy
Part (c)
800
70
60
50
40
30
20
10
1950
1970 1990
W
ALT
林
$
#
4
R
J7
Year of
2010 Birth
F6
4+
80
70
60
50
40
30
20
10
Year of
1950 1970 1990
2010 Birth
Life
Expectancy
Ox
800
70
60
50
40
30
20
10
Year of
1950 1970 1990 2010 Birth
hp
P.B.
KA
&
7
80
% 5
H
A
B
F10
711
N
M
K
744
PRT SC
ALT
CTRL
Harvard University
California Institute of Technology
Massachusetts Institute of Technology
Stanford University
Princeton University
University of Cambridge
University of Oxford
University of California, Berkeley
Imperial College London
Yale University
University of California, Los Angeles
University of Chicago
Johns Hopkins University
Cornell University
ETH Zurich
University of Michigan
University of Toronto
Columbia University
University of Pennsylvania
Carnegie Mellon University
University of Hong Kong
University College London
University of Washington
Duke University
Northwestern University
University of Tokyo
Georgia Institute of Technology
Pohang University of Science and Technology
University of California, Santa Barbara
University of British Columbia
University of North Carolina at Chapel Hill
University of California, San Diego
University of Illinois at Urbana-Champaign
National University of Singapore
McGill…
Name
Harvard University
California Institute of Technology
Massachusetts Institute of Technology
Stanford University
Princeton University
University of Cambridge
University of Oxford
University of California, Berkeley
Imperial College London
Yale University
University of California, Los Angeles
University of Chicago
Johns Hopkins University
Cornell University
ETH Zurich
University of Michigan
University of Toronto
Columbia University
University of Pennsylvania
Carnegie Mellon University
University of Hong Kong
University College London
University of Washington
Duke University
Northwestern University
University of Tokyo
Georgia Institute of Technology
Pohang University of Science and Technology
University of California, Santa Barbara
University of British Columbia
University of North Carolina at Chapel Hill
University of California, San Diego
University of Illinois at Urbana-Champaign
National University of Singapore…
Calculus for Business, Economics, Life Sciences, and Social Sciences (14th Edition)
Knowledge Booster
Learn more about
Need a deep-dive on the concept behind this application? Look no further. Learn more about this topic, statistics and related others by exploring similar questions and additional content below.
Introduction to experimental design and analysis of variance (ANOVA); Author: Dr. Bharatendra Rai;https://www.youtube.com/watch?v=vSFo1MwLoxU;License: Standard YouTube License, CC-BY


 Glencoe Algebra 1, Student Edition, 9780079039897...AlgebraISBN:9780079039897Author:CarterPublisher:McGraw Hill
 Holt Mcdougal Larson Pre-algebra: Student Edition...AlgebraISBN:9780547587776Author:HOLT MCDOUGALPublisher:HOLT MCDOUGAL
 College Algebra (MindTap Course List)AlgebraISBN:9781305652231Author:R. David Gustafson, Jeff HughesPublisher:Cengage Learning
 Big Ideas Math A Bridge To Success Algebra 1: Stu...AlgebraISBN:9781680331141Author:HOUGHTON MIFFLIN HARCOURTPublisher:Houghton Mifflin Harcourt