Videos
1.
Prepare quality cost report and pie chart.
1.
Explanation of Solution
Quality Cost:
Organizations are required to bear costs due to non-conformity of goods or services with the general specifications. These costs are termed as quality costs. Quality costs can be categorized into preventive costs, detective costs, internal failure costs and external failure costs.
Preparation of quality cost report:
| Particulars | Year 1 ($) | Year 2 ($) |
| Prevention costs: | ||
| Quality circles | 6,000 | 60,000 |
| Design reviews | 3,000 | 30,000 |
| Quality improvement projects | 3,000 | 150,000 |
| Total prevention costs (A) | 12,000 | 240,000 |
| Percentage (E) | 0.39% | 7.81% |
| Detection costs: | ||
| Packaging inspection | 480,000 | 450,000 |
| Product acceptance | 60,000 | 42,000 |
| Total detection costs (B) | 540,000 | 492,000 |
| Percentage (F) | 17.58% | 16.02% |
| Internal failure costs: | ||
| Scrap | 420,000 | 360,000 |
| Rework | 540,000 | 480,000 |
| Yield losses | 240,000 | 150,000 |
| Retesting | 300,000 | 240,000 |
| Total internal failure costs (C) | 1,500,000 | 1,230,000 |
| Percentage (G) | 48.83% | 40.04% |
| External failure costs: | ||
| Returned materials | 240,000 | 240,000 |
| Allowances | 180,000 | 210,000 |
| Warranty | 600,000 | 660,000 |
| Total external failure costs (D) | 1,020,000 | 1,110,000 |
| Percentage (H) | 33.20% | 36.13% |
| Total quality costs | 3,072,000 | 3,072,000 |
| Total percentage | 100% | 100% |
Table (1)
Pie chart for year 1:
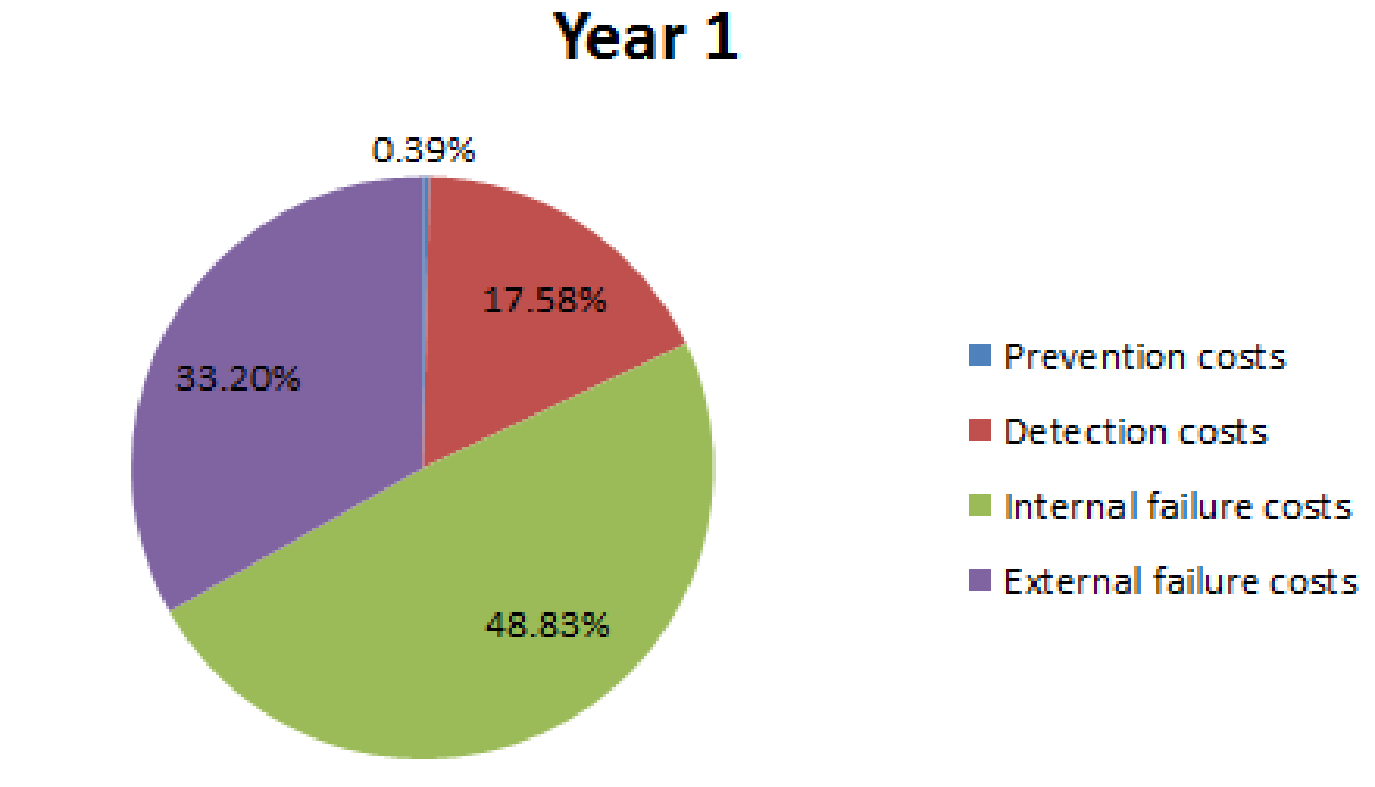
Fig (1)
Pie chart for year 2:
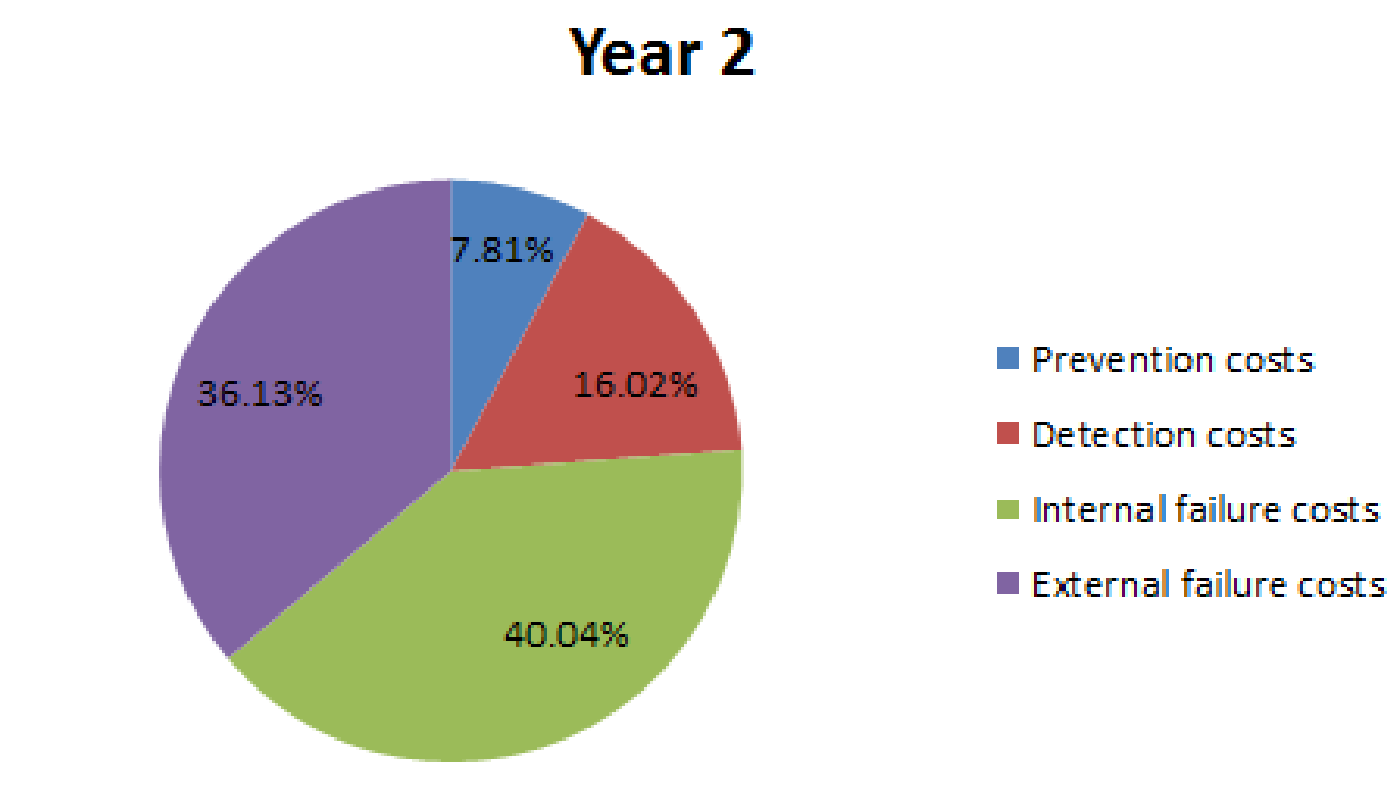
Fig (2)
Analysis of pie charts:
- The distribution pattern shown in the chart in year 1 is not appropriate.
- External failure costs and internal failure costs are much higher than their required levels.
- In comparison with year 1, year 2 is moving towards a right balance; since failure costs are reducing and prevention costs are increasing.
2.
Present a performance report for year 2 by comparing budgeted and actual figures of year 2. Also, compute the profits that have been increased due to quality improvements.
2.
Answer to Problem 55P
Increase in profit due to quality improvements is $768,000.
Explanation of Solution
Preparation of quality cost report:
| Particulars |
Year 1 ($) |
Year 2 Budgeted ($) (E) |
Year 2 Actual ($) (F) |
Variance ($) |
| Prevention costs: | ||||
| Quality circles | 6,000 | 7,500 | 60,000 | |
| Design reviews | 3,000 | 3,750 | 30,000 | |
| Quality improvement projects | 3,000 | 3,750 | 150,000 | |
| Total prevention costs (A) | 12,000 | 15,000 | 240,000 | |
| Detection costs: | ||||
| Packaging inspection | 480,000 | 600,000 | 450,000 | 150,000 |
| Product acceptance | 60,000 | 75,000 | 42,000 | 33,000 |
| Total detection costs (B) | 540,000 | 675,000 | 492,000 | 183,000 |
| Internal failure costs: | ||||
| Scrap | 420,000 | 525,000 | 360,000 | 165,000 |
| Rework | 540,000 | 675,000 | 480,000 | 195,000 |
| Yield losses | 240,000 | 300,000 | 150,000 | 150,000 |
| Retesting | 300,000 | 375,000 | 240,000 | 135,000 |
| Total internal failure costs (C) | 1,500,000 | 1,875,000 | 1,230,000 | 645,000 |
| External failure costs: | ||||
| Returned materials | 240,000 | 300,000 | 240,000 | 60,000 |
| Allowances | 180,000 | 225,000 | 210,000 | 15,000 |
| Warranty | 600,000 | 750,000 | 660,000 | 90,000 |
| Total external failure costs (D) | 1,020,000 | 1,275,000 | 1,110,000 | 165,000 |
|
Total quality costs | 3,072,000 | 3,840,000 | 3,072,000 | 768,000 |
Table (2)
Year 2 budgeted figures are computed by dividing the costs of year 1 by sales of year 1 $12,000,000 and multiplying by sales of year 2, $15,000,000.
Increase in profit due to quality improvements is $768,000.
3.
Compute increase in profits in case quality costs are reduced to 3% of sales revenue.
3.
Explanation of Solution
Computation of increase in profit:
| Particulars | Amount ($) |
| Existing total quality costs (A) | 3,072,000 |
| Sales | 15,000,000 |
|
Revised total quality costs (B) | 450,000 |
| Increase in profit | 2,622,000 |
Table (3)
Want to see more full solutions like this?
Chapter 13 Solutions
EBK MANAGERIAL ACCOUNTING: THE CORNERST


- calculate the unit cost per gear ?arrow_forwardcalculate the companys net income ?arrow_forwardChapter 21 Homework i Saved You received partial credit in the previous attempt. 00 8 Exercise 21-3 (Algo) Preparing flexible budgets LO P1 1.25 points 04:49:00 Tempo Company's fixed budget (based on sales of 12,000 units) folllows. Fixed Budget eBook + Hint Ask Print Sales (12,000 units x $216 per unit) Costs Direct materials Direct labor Indirect materials Supervisor salary Sales commissions Shipping Administrative salaries. Depreciation-Office equipment Insurance Office rent Income 1. Compute total variable cost per unit. 2. Compute total fixed costs. 2,592,000 288,000 528,000 336,000 88,000 84,000 192,000 138,000 108,000 78,000 88,000 664,000 3. Prepare a flexible budget at activity levels of 10,000 units and 14,000 units. 5 References Mc Graw Hill Complete this question by entering your answers in the tabs below. Required 1 Required 2 Required 3 Prepare flexible budget at activity levels of 10,000 units and 14,000 units. Sales Variable costs Direct materials Direct labor Indirect…arrow_forward
 Managerial Accounting: The Cornerstone of Busines...AccountingISBN:9781337115773Author:Maryanne M. Mowen, Don R. Hansen, Dan L. HeitgerPublisher:Cengage Learning
 Cornerstones of Cost Management (Cornerstones Ser...AccountingISBN:9781305970663Author:Don R. Hansen, Maryanne M. MowenPublisher:Cengage Learning