Concept explainers
a.
Identify the company which appears to be the largest at the end of Year 3, based on revenue.
a.
Answer to Problem 4MAD
The company which appears to be the largest using the revenue at the end of Year 3 is Company AT.
Explanation of Solution
Statement of
Statement of cash flow is a financial statement that shows the cash and cash equivalents of a company for a particular period of time. It shows the net changes in cash, by reporting the sources and uses of cash as a result of operating, investing, and financing activities of a company.
Company AT has more revenue of $163,786 which is more than the revenue of Company F of revenue $27,638. Hence, Company AT appears to be the largest revenue earning company at the end of Year 3.
b.
Identify the company which appears to be growing faster across the three years.
b.
Answer to Problem 4MAD
Company which appears to be growing faster across the three years is Company F.
Explanation of Solution
Identify the company which appears to be growing faster across the three years.
| Company | Year 3 | Year 2 | Year 1 |
| AT | 124% (1) | 111% (2) | 100% |
| F | 222% (3) | 144% (4) | 100% |
Table (1)
Working note (1):
Calculate the growth rate of Company AT for Year 3.
Working note (2):
Calculate the growth rate of Company AT for Year 2.
Working note (3):
Calculate the growth rate of Company F for Year 3.
Working note (4):
Calculate the growth rate of Company F for Year 2.
Hence, the company which appears to be growing faster across the three years is Company F.
c.
Compute the cash used to purchase property, plant, and equipment as a percent of the cash flows from operating activities for all three years for each company.
c.
Explanation of Solution
Compute the cash used to purchase property, plant, and equipment as a percent of the cash flows from operating activities for all three years for each company.
| Company AT | Year 3 | Year 2 | Year 1 |
| Cash flows from operating activities (A) | $39,344 | $35,880 | $31,338 |
| Cash used to purchase property, plant, and equipment (B) | $22,408 | $20,015 | $21,433 |
| Cash used to purchase property, plant, and equipment as a percentage of the cash flows from operating activities | 57% | 56% | 68% |
| Company F | Year 3 | Year 2 | Year 1 |
| Cash flows from operating activities (A) | $16,108 | $10,320 | $7,326 |
| Cash used to purchase property, plant, and equipment (B) | $4,491 | $2,523 | $1,831 |
| Cash used to purchase property, plant, and equipment as a percentage of the cash flows from operating activities | 28% | 24% | 25% |
Table (2)
d.
Identify the company which appears to require more cash to purchase property, plant, and equipment and explain its impact on
d.
Answer to Problem 4MAD
By using the computation in (C), it is clear that the company which appears to require more cash to purchase property, plant, and equipment is Company AT, and its impact on free cash flow is more negative.
Explanation of Solution
The cash used to purchase property, plant, and equipment as a percent of the cash flows from operating activities of Company F for Year 1 is 25% which is much less than that of Company AT of 68%. Both the company’s requirement of cash is increasing year by year, but Company AT’s requirement is higher than Company F’s requirement.
Hence, as the cash used to purchase property, plant, and equipment as a percent of the cash flows from operating activities of Company AT from Year 1 to Year 3 is increasing, the company which appears to require more cash to purchase property, plant, and equipment is Company AT, and its net impact on free cash flow is more negative.
e.
Compute the ratio of free cash flow to revenue for all three years for each company, and plot the data on a line chart.
e.
Explanation of Solution
Compute the free cash flow of Company AT.
| Year 3 | Year 2 | Year 1 | |
| Cash flows from operating activities | $39,344 | $35,880 | $31,338 |
| Less: Cash used to purchase property, plant, and equipment |
($22,408) |
($20,015) |
($21,433) |
| Free cash flow | $16,936 | $15,865 | $9,905 |
Table (3)
Compute the ratio of free cash flow to revenue for Company AT.
| Year 3 | Year 2 | Year 1 | |
| Free cash flow (A) | $16,936 | $15,865 | $9,905 |
| Revenue (B) | $163,786 | $146,801 | $132,447 |
|
Ratio of free cash flow to revenue | 10.3% | 10.8% | 7.5% |
Table (4)
Compute the free cash flow of Company F.
| Year 3 | Year 2 | Year 1 | |
| Cash flows from operating activities | $16,108 | $10,320 | $7,326 |
| Less: Cash used to purchase property, plant, and equipment | $4,491 | $2,523 | $1,831 |
| Free cash flow | $11,617 | $7,797 | $5,495 |
Table (5)
Compute the ratio of free cash flow to revenue for Company F.
| Year 3 | Year 2 | Year 1 | |
| Free cash flow (A) | $11,617 | $7,797 | $5,495 |
| Revenue (B) | $27,638 | $17,928 | $12,466 |
|
Ratio of free cash flow to revenue | 42.0% | 43.5% | 44.1% |
Table (6)
Plot the free cash flow to revenue of both the companies on a line chart.
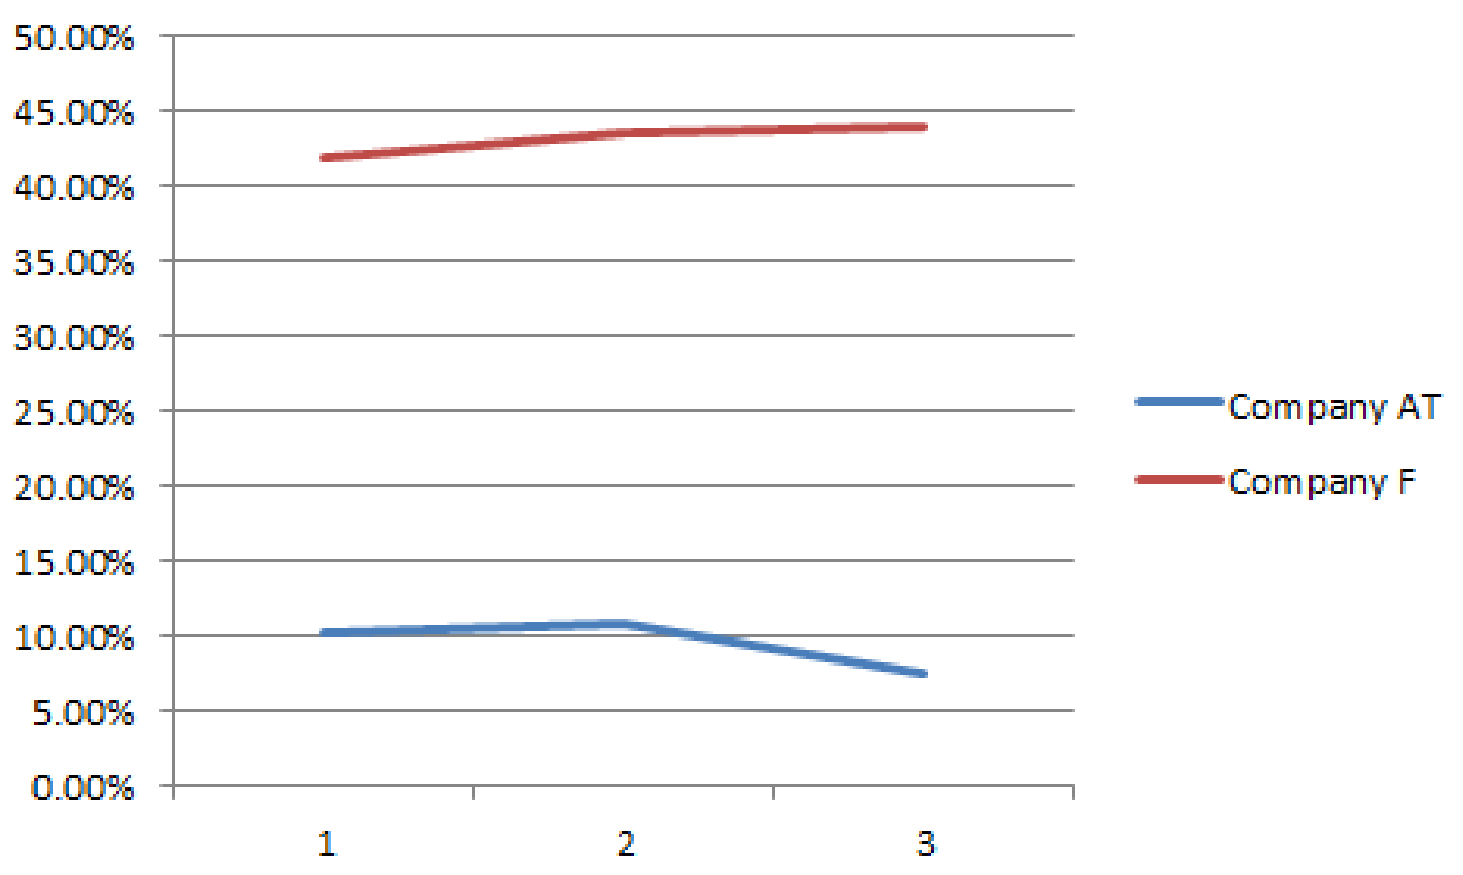
Hence, the ratio of free cash flow to revenue for Year 3, Year 2, and Year 1 for Company AT are 10.3%, 10.8%, and 7.5% respectively, and for Company F is 42.0%, 43.5%, and 44.1% respectively.
f.
Interpret the chart.
f.
Explanation of Solution
The ratio of free cash flow to revenue of Company F for Year 1 was better when compared to Company AT, as Company F’s ratio is almost 6 times higher than Company AT’s ratio. But in the Year 2, and Year 3, the ratios of free cash flow to revenue of Company F were not much greater than Company AT.
Individually, both companies ratio is remained stable over the years, as both the cash flow from operating activities and cash used to purchase property, plant, and equipment were increasing steadily. However, Company F’s requirement to purchase property, plant, and equipment has increased more than the increase in cash flow from operating activities.
This has caused the decline in the ratio of free cash flow to revenue for Company F in year 2 and year 3.
Want to see more full solutions like this?
Chapter 13 Solutions
Financial and Managerial Accounting - CengageNow


- Please help me solve this financial accounting question using the right financial principles.arrow_forwardSales made in fiscal 2025 for $50,000,000 include a 5-year warranty coverage. The estimated cost for warranty is expected to be 2% for each of the first 4 years and 5% for the last year. Determine how much warranty expense will be recorded in fiscal 2025. Question 2 options: $6,500,000 $4,000,000 $1,000,000 $5,000,000arrow_forwardAgree or disagree with the post Financial statements provide raw data, but without analysis, they lack meaningful insight. Different tools help uncover trends, assess financial health, and compare performance effectively. Horizontal analysis tracks changes over time, identifying growth patterns or declines. Vertical analysis expresses financial items as percentages of a base figure, making comparisons across companies easier. Like liquidity, profitability, and solvency measures, ratios offer critical efficiency, risk, and stability assessments. These tools translate numbers into actionable intelligence, helping businesses, investors, and analysts spot risks, make informed decisions, and drive strategic planning. Without them, financial statements can be overwhelming and lack clarity. Agree or disagree with the postarrow_forward
- A $100,000 5-year 6% bond is issued on January 1, 2026. The bond pays interest annually. The market rate is 7%. What is the selling price of the bonds, rounded to the nearest dollar? Question 6 options: $104,213 $95,900 $100,000 $4,100arrow_forwardA $100,000 5-year 6% bond is issued on January 1, 2026. The bond pays interest annually. The market rate is 7%. What is the selling price of the bonds, rounded to the nearest dollar? Question 6 options: $104,213 $95,900 $100,000 $4,100arrow_forwardDell Industries has a normal capacity of 30,000 direct labor hours. The company's variable costs are $45,000, and its fixed costs are $27,000 when operating at normal capacity. What is its standard manufacturing overhead rate per unit?arrow_forward
- Which statement about a "treasury shares" is correct? Question 10 options: These shares continue to have voting rights. These shares must be cancelled upon re-purchase. The company does not pay dividends on these shares. These shares are disclosed as issued and outstanding.arrow_forwardWhich statement best describes the accounting when a company cancels its own shares at an amount higher than the average share value? Question 9 options: Contributed surplus and retained earnings will be debited. Contributed surplus will be debited, thereby decreasing equity. Contributed surplus and retained earnings will be credited. Contributed surplus will be credited, thereby increasing equity.arrow_forwardWhich statement is correct? Question 8 options: A corporation need only pay dividends when it declares them to be payable. A company can avoid a cumulative dividend on preferred shares if it declares dividends on common shares. Dividends are never discretionary payments. Companies must pay the shareholders interest to compensate for the time value of money lost on the deferral of dividend payments. No entryarrow_forward
 Business/Professional Ethics Directors/Executives...AccountingISBN:9781337485913Author:BROOKSPublisher:Cengage
 Accounting Information SystemsAccountingISBN:9781337619202Author:Hall, James A.Publisher:Cengage Learning,
 Managerial Accounting: The Cornerstone of Busines...AccountingISBN:9781337115773Author:Maryanne M. Mowen, Don R. Hansen, Dan L. HeitgerPublisher:Cengage Learning
 Pkg Acc Infor Systems MS VISIO CDFinanceISBN:9781133935940Author:Ulric J. GelinasPublisher:CENGAGE L
 Financial AccountingAccountingISBN:9781337272124Author:Carl Warren, James M. Reeve, Jonathan DuchacPublisher:Cengage Learning