
Concept explainers
Videos
(a)
To graph: A line plot for the given data is to be drawn.
(a)
Explanation of Solution
Given information: Data of first 20 states were admitted in Union in the following years:
Graph:
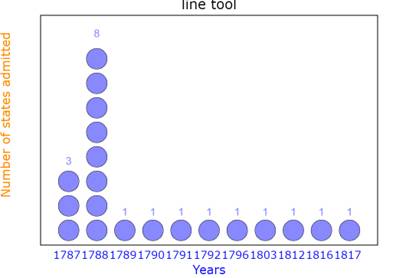
Interpretation:
A line plot shows that that maximum number of states admitted in year
(b)
To graph: A frequency distribution for the given data is to be drawn.
(b)
Explanation of Solution
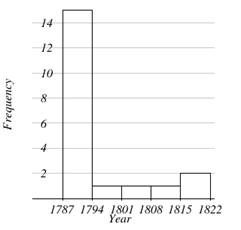
Given information: Data of first 20 states were admitted in Union in the following years:
Graph:
| Interval | Tally Marks | Frequency |
| 1787-1793 | |||| |||| |||| | 15 |
| 1794-1801 | | | 1 |
| 1802-1808 | | | 1 |
| 1809-1815 | | | 1 |
| 1816-1822 | || | 2 |
Interpretation:
Shows that that the least year is
(a)
To graph: A histogram for the given data is to be drawn.
(a)
Explanation of Solution
Given information: Data of first 20 states were admitted in Union in the following years:
Graph:
Interpretation:
Maximum numbers of states were admitted in year interval
(c)
To graph: A line plot for the given data is to be drawn.
(c)
Explanation of Solution
Given information: Data of ages of adult male passengers on the Mayflower at the time of its departure
Graph:
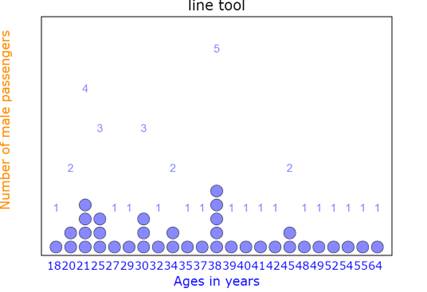
Interpretation: Out of all age groups, the maximum male adult passengers having age of 38 years have been departure.
(d)
To graph: A frequency distribution for the given data is to be drawn.
(d)
Explanation of Solution
Given information: Data of ages of adult male passengers on the Mayflower at the time of its departure
Graph:
| Interval | Tally Marks | Frequency |
| 18-27 | |||| |||| |||| | | 11 |
| 28-37 | |||| |||| | 9 |
| 38-47 | |||| |||| |||| | | 11 |
| 48-57 | |||| | 5 |
| 58-67 | | | 1 |
Interpretation: From above distribution we conclude that least age is 18 and greatest age is 64
e)
To graph: A histogram for the given data is to be drawn.
e)
Explanation of Solution
Given information: Data of ages of adult male passengers on the Mayflower at the time of its departure
Graph:
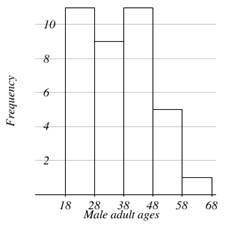
Interpretation: From above we conclude that maximum male adult passengers of age group under
e)
To graph: A histogram for the given data is to be drawn.
e)
Explanation of Solution
Given information: Data of ages of adult male passengers on the Mayflower at the time of its departure
Graph:
Interpretation: From above we conclude that maximum male adult passengers of age group under
Chapter 13 Solutions
EBK PRECALCULUS W/LIMITS


- Calculus III May I please have some elaborations on Example 2 part a? Thank you.arrow_forward1. A bicyclist is riding their bike along the Chicago Lakefront Trail. The velocity (in feet per second) of the bicyclist is recorded below. Use (a) Simpson's Rule, and (b) the Trapezoidal Rule to estimate the total distance the bicyclist traveled during the 8-second period. t 0 2 4 6 8 V 10 15 12 10 16 2. Find the midpoint rule approximation for (a) n = 4 +5 x²dx using n subintervals. 1° 2 (b) n = 8 36 32 28 36 32 28 24 24 20 20 16 16 12 8- 4 1 2 3 4 5 6 12 8 4 1 2 3 4 5 6arrow_forward= 5 37 A 4 8 0.5 06 9arrow_forward
- Consider the following system of equations, Ax=b : x+2y+3z - w = 2 2x4z2w = 3 -x+6y+17z7w = 0 -9x-2y+13z7w = -14 a. Find the solution to the system. Write it as a parametric equation. You can use a computer to do the row reduction. b. What is a geometric description of the solution? Explain how you know. c. Write the solution in vector form? d. What is the solution to the homogeneous system, Ax=0?arrow_forward2. Find a matrix A with the following qualities a. A is 3 x 3. b. The matrix A is not lower triangular and is not upper triangular. c. At least one value in each row is not a 1, 2,-1, -2, or 0 d. A is invertible.arrow_forwardFind the exact area inside r=2sin(2\theta ) and outside r=\sqrt(3)arrow_forward
- A 20 foot ladder rests on level ground; its head (top) is against a vertical wall. The bottom of the ladder begins by being 12 feet from the wall but begins moving away at the rate of 0.1 feet per second. At what rate is the top of the ladder slipping down the wall? You may use a calculator.arrow_forwardExplain the focus and reasons for establishment of 12.4.1(root test) and 12.4.2(ratio test)arrow_forwarduse Integration by Parts to derive 12.6.1arrow_forward
- Explain the relationship between 12.3.6, (case A of 12.3.6) and 12.3.7arrow_forwardExplain the key points and reasons for the establishment of 12.3.2(integral Test)arrow_forwardUse 12.4.2 to determine whether the infinite series on the right side of equation 12.6.5, 12.6.6 and 12.6.7 converges for every real number x.arrow_forward
 Calculus: Early TranscendentalsCalculusISBN:9781285741550Author:James StewartPublisher:Cengage Learning
 Thomas' Calculus (14th Edition)CalculusISBN:9780134438986Author:Joel R. Hass, Christopher E. Heil, Maurice D. WeirPublisher:PEARSON
 Calculus: Early Transcendentals (3rd Edition)CalculusISBN:9780134763644Author:William L. Briggs, Lyle Cochran, Bernard Gillett, Eric SchulzPublisher:PEARSON
 Calculus: Early TranscendentalsCalculusISBN:9781319050740Author:Jon Rogawski, Colin Adams, Robert FranzosaPublisher:W. H. Freeman
 Calculus: Early Transcendental FunctionsCalculusISBN:9781337552516Author:Ron Larson, Bruce H. EdwardsPublisher:Cengage Learning