
(a)
The IS-LM curve of the economy.
(a)
Explanation of Solution
The IS-LM curves of the economy can be calculated from the given details. It is given that the value of
Similarly, the LM curve of the economy can be obtained by equating the money market as follows:
Mundell - Fleming model: The Mundell Fleming model is the extended version of the IS-LM model of the economy that incorporates the BOP into the equilibrium. Thus, it is the model that portrays the short run relationship between the nominal exchange rate of the economy, interest rate and the output.
(b)
The equilibrium exchange rate, income, and net exports.
(b)
Explanation of Solution
The equilibrium exchange rate of the economy can be calculated by equating the output (Y) from both the IS curve and the LM curve as follows:
Thus, the equilibrium exchange rate in the economy is 2. The equilibrium income in the economy can be calculated by substituting the value of net exports in the equation above as follows:
Thus, the equilibrium income in the economy is equal to 1,200. The net exports in the economy can be calculated by substituting the value of the exchange rate in the net exports as follows:
Thus, the net exports in the economy is equal to 100.
(c)
The IS and LM curves when the government spending increases by 50.
(c)
Explanation of Solution
When there is an increase in the government spending by 50, the new IS curve can be derived as follows:
Since the economy has the floating exchange rate, the LM curve of the economy remains unchanged. As a result, there will be no change in the income and output of the economy. Thus, the income remains at 1,200. Therefore, the new exchange rate can be calculated as follows:
Thus, the exchange rate is 3. A higher exchange rate decreases the exports as the domestic currency appreciates and becomes costly to the foreign countries. Thus, the increased government spending will be matched by a lower net exports. This can be illustrated as follows:
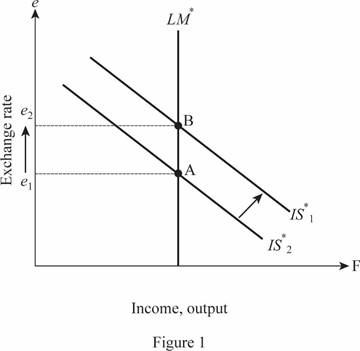
Thus, the IS curve shifts toward the right graphically, whereas the exchange rate increases.
(d)
The IS and LM curves when the government spending increases by 50 under fixed exchange rate.
(d)
Explanation of Solution
When there is an increase in the government spending by 50, the new IS equation becomes
Thus, when the exchange rate is fixed at 2, the equilibrium income should increase to 1,400. As a result, the money supply must be increased by the monetary authority to keep the exchange rate fixed at 2. Therefore, M would increase to 3,600 due to the rightward shift in the LM curve and it can be illustrated as follows:
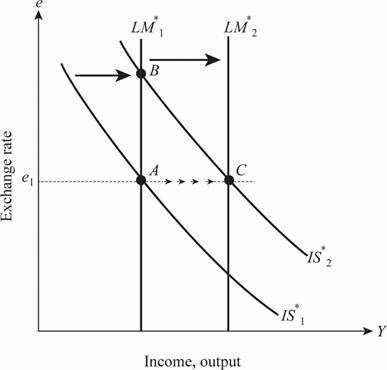
Thus, the IS curve shifts toward the right increases the exchange rate, whereas the increase in the money supply leads to the rightward shift in the LM curve which brings the exchange rate back to the original position with increased output and income.
Want to see more full solutions like this?

- As indicated in the attached image, U.S. earnings for high- and low-skill workers as measured by educational attainment began diverging in the 1980s. The remaining questions in this problem set use the model for the labor market developed in class to walk through potential explanations for this trend. 1. Assume that there are just two types of workers, low- and high-skill. As a result, there are two labor markets: supply and demand for low-skill workers and supply and demand for high-skill workers. Using two carefully drawn labor-market figures, show that an increase in the demand for high skill workers can explain an increase in the relative wage of high-skill workers. 2. Using the same assumptions as in the previous question, use two carefully drawn labor-market figures to show that an increase in the supply of low-skill workers can explain an increase in the relative wage of high-skill workers.arrow_forwardPublished in 1980, the book Free to Choose discusses how economists Milton Friedman and Rose Friedman proposed a one-sided view of the benefits of a voucher system. However, there are other economists who disagree about the potential effects of a voucher system.arrow_forwardThe following diagram illustrates the demand and marginal revenue curves facing a monopoly in an industry with no economies or diseconomies of scale. In the short and long run, MC = ATC. a. Calculate the values of profit, consumer surplus, and deadweight loss, and illustrate these on the graph. b. Repeat the calculations in part a, but now assume the monopoly is able to practice perfect price discrimination.arrow_forward
- how commond economies relate to principle Of Economics ?arrow_forwardCritically analyse the five (5) characteristics of Ubuntu and provide examples of how they apply to the National Health Insurance (NHI) in South Africa.arrow_forwardCritically analyse the five (5) characteristics of Ubuntu and provide examples of how they apply to the National Health Insurance (NHI) in South Africa.arrow_forward


 Economics (MindTap Course List)EconomicsISBN:9781337617383Author:Roger A. ArnoldPublisher:Cengage Learning