
Concept explainers
Videos
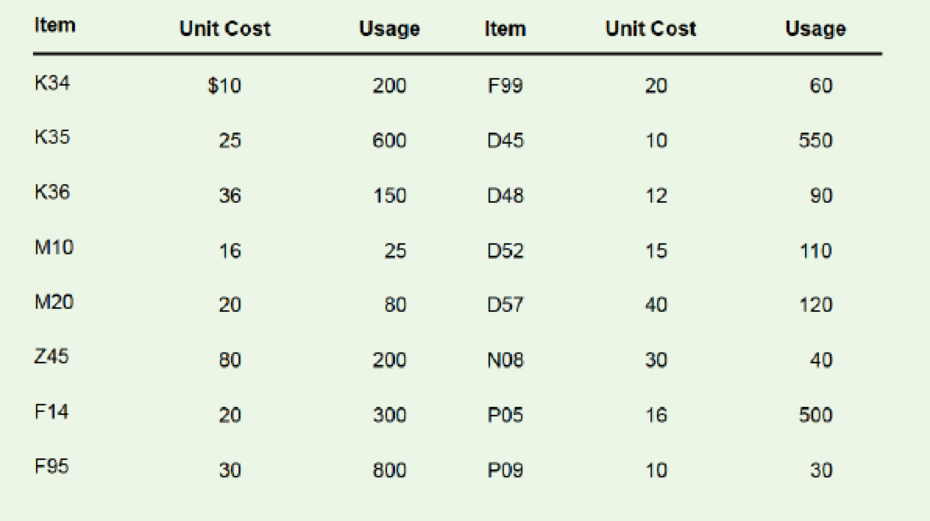
a. The following table contains figures on the monthly volume and unit costs for a random sample of 16 items from a list of 2,000 inventory items at a health care facility. Develop an A-B-C classification for these items.
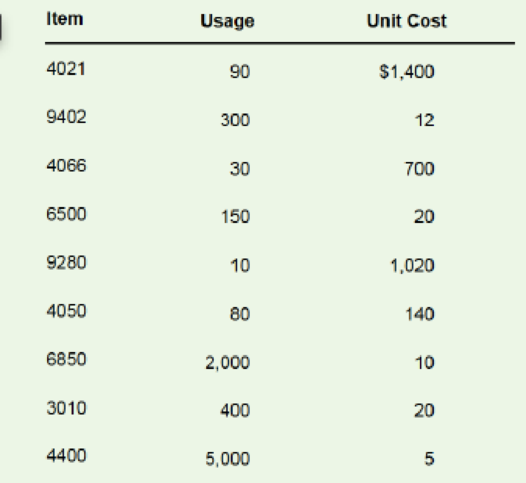
b. Given the monthly usages in the following table, classify the items in A, B, and C categories according to dollar usage.
C. Determine the percentage of items in each category and the annual dollar value for each category for pan b.
a)
To determine: ABC classification for the items.
Introduction: Inventory is a stock or store of goods. Every company store lots of goods as inventory which will be used during replenishment periods. Management of inventory is so much essential to manage cost and also to reduce cost.
Answer to Problem 2P
Explanation of Solution
Given information:
| Item | Unit Cost | Usage |
| K34 | $10 | 200 |
| K35 | 25 | 600 |
| K36 | 36 | 150 |
| M10 | 16 | 25 |
| M20 | 20 | 80 |
| Z45 | 80 | 200 |
| F14 | 20 | 300 |
| F95 | 30 | 800 |
| F99 | 20 | 60 |
| D45 | 10 | 550 |
| D48 | 12 | 90 |
| D52 | 15 | 110 |
| D57 | 40 | 120 |
| N08 | 30 | 40 |
| P05 | 16 | 500 |
| P09 | 10 | 30 |
Calculation for ABC classification:
Step 1: Calculation of annual dollar value
| Item | Unit Cost | Usage | Annual dollar value |
| K34 | $10 | 200 | $2,000 |
| K35 | 25 | 600 | $15,000 |
| K36 | 36 | 150 | $5,400 |
| M10 | 16 | 25 | $400 |
| M20 | 20 | 80 | $1,600 |
| Z45 | 80 | 200 | $16,000 |
| F14 | 20 | 300 | $6,000 |
| F95 | 30 | 800 | $24,000 |
| F99 | 20 | 60 | $1,200 |
| D45 | 10 | 550 | $5,500 |
| D48 | 12 | 90 | $1,080 |
| D52 | 15 | 110 | $1,650 |
| D57 | 40 | 120 | $4,800 |
| N08 | 30 | 40 | $1,200 |
| P05 | 16 | 500 | $8,000 |
| P09 | 10 | 30 | $300 |
| Total | $94,130 |
The annual dollar value is the product of unit cost and annual volume. For K34, the product of $10 and 200 gives $2,000 which is the dollar value for K34 and same procedure is followed for others items and the sum accounts to $94,130.
Step 2: Classification of items
| Item | Unit Cost | Usage | Annual dollar value | Category | Percentage of items | Percentage of annual dollar value |
| F95 | 30 | 800 | $24,000 | A | 18.75% | 58.43% |
| Z45 | 80 | 200 | $16,000 | |||
| K35 | 25 | 600 | $15,000 | |||
| P05 | 16 | 500 | $8,000 | B | 31.25% | 31.55% |
| F14 | 20 | 300 | $6,000 | |||
| D45 | 10 | 550 | $5,500 | |||
| K36 | 36 | 150 | $5,400 | |||
| D57 | 40 | 120 | $4,800 | |||
| K34 | $10 | 200 | $2,000 | C | 50.00% | 10.02% |
| D52 | 15 | 110 | $1,650 | |||
| M20 | 20 | 80 | $1,600 | |||
| F99 | 20 | 60 | $1,200 | |||
| N08 | 30 | 40 | $1,200 | |||
| D48 | 12 | 90 | $1,080 | |||
| M10 | 16 | 25 | $400 | |||
| P09 | 10 | 30 | $300 | |||
| Total | $94,130 |
Table 1
Excel Worksheet:
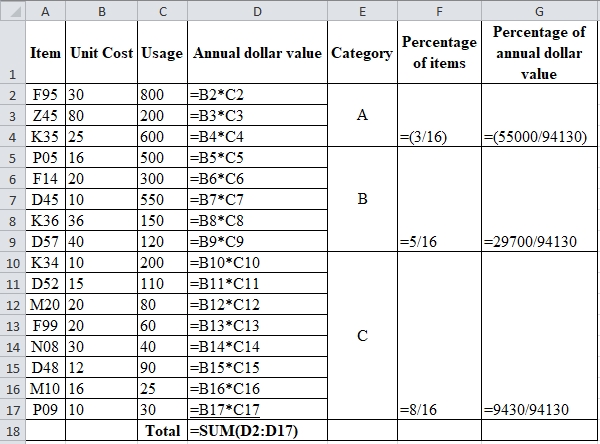
The items are classified based on their percentage of dollar value where 10-15% are classified as A items and 50% are classified as B items and lowest value are classified as C item which is shown in table 1.
Hence, ABC classification of items is shown in table 1.
b)
To determine:ABC classification for the items.
Introduction: Inventory is a stock or store of goods. Every company store lots of goods as inventory which will be used during replenishment periods. Management of inventory is so much essential to manage cost and also to reduce cost.
Answer to Problem 2P
Explanation of Solution
| Item | Usage | Unit Cost |
| 4021 | 90 | $1,400 |
| 9402 | 300 | 12 |
| 4066 | 30 | 700 |
| 6500 | 150 | 20 |
| 9280 | 10 | 1,020 |
| 4050 | 80 | 140 |
| 6850 | 2,000 | 10 |
| 3010 | 400 | 20 |
| 4400 | 5,000 | 5 |
Given information:
Calculation for ABC classification:
Step 1: Calculation of annual dollar value
| Item | Usage | Unit Cost | Annual dollar value |
| 4021 | 90 | $1,400 | $126,000 |
| 9402 | 300 | 12 | $3,600 |
| 4066 | 30 | 700 | $21,000 |
| 6500 | 150 | 20 | $3,000 |
| 9280 | 10 | 1,020 | $10,200 |
| 4050 | 80 | 140 | $11,200 |
| 6850 | 2,000 | 10 | $20,000 |
| 3010 | 400 | 20 | $8,000 |
| 4400 | 5,000 | 5 | $25,000 |
| Total | $228,000 |
The annual dollar value is the product of unit cost and annual volume. For item 4021, the product of 90 and $1400 gives $126,000 which is the dollar value for item 4021 and same procedure is followed for others items and the sum accounts to $228,000.
Step 2: Classification of items:
| Item | Usage | Unit Cost | Annual dollar value | Category | Percentage of items | Percentage of annual dollar value |
| 4021 | 90 | $1,400 | $126,000 | A | 11.11% | 55.26% |
| 4400 | 5,000 | 5 | $25,000 | B | 33.33% | 28.95% |
| 4066 | 30 | 700 | $21,000 | |||
| 6850 | 2,000 | 10 | $20,000 | |||
| 4050 | 80 | 140 | $11,200 | C | 55.56% | 15.79% |
| 9280 | 10 | 1,020 | $10,200 | |||
| 3010 | 400 | 20 | $8,000 | |||
| 9402 | 300 | 12 | $3,600 | |||
| 6500 | 150 | 20 | $3,000 | |||
| Total | $228,000 |
Table 2
Excel Worksheet:
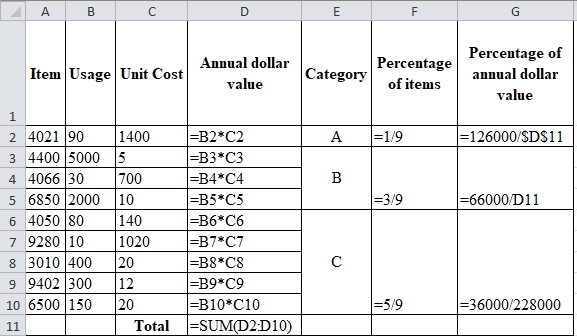
The items are classified based on their percentage of dollar value where 10-15% are classified as A items and 50% are classified as B items and lowest value are classified as C item which is shown in table 2.
Hence, ABC classification of items is shown in table 2.
c)
To determine: The percentage of items in each category and their respective annual dollar value.
Introduction: Inventory is a stock or store of goods. Every company store lots of goods as inventory which will be used during replenishment periods. Management of inventory is so much essential to manage cost and also to reduce cost.
Answer to Problem 2P
Explanation of Solution
Given information:
| Item | Unit Cost | Usage |
| K34 | $10 | 200 |
| K35 | 25 | 600 |
| K36 | 36 | 150 |
| M10 | 16 | 25 |
| M20 | 20 | 80 |
| Z45 | 80 | 200 |
| F14 | 20 | 300 |
| F95 | 30 | 800 |
| F99 | 20 | 60 |
| D45 | 10 | 550 |
| D48 | 12 | 90 |
| D52 | 15 | 110 |
| D57 | 40 | 120 |
| N08 | 30 | 40 |
| P05 | 16 | 500 |
| P09 | 10 | 30 |
Percentage of items in each category and their respective annual dollar value:
The percentage of items in each category and their respective annual dollar values are computed and shown in the classification table which is table 2.
Hence, the percentage of items in each category and their respective annual dollar value is shown in table 2,
Want to see more full solutions like this?
Chapter 13 Solutions
EBK OPERATIONS MANAGEMENT


- The deaths are included in the discharges; this includes deaths occurring in less than 48 hours and postoperative deaths. Rehabilitation had 362 discharges, 22 deaths, 1<48 hours, 0 Postoperative. what is the gross death rate for the rehabilitation service?arrow_forwardA copy machine is available 24 hours a day. On a typical day, the machine produces 100 jobs. Each job takes about 3 minutes on the machine, 2 minutes of which is processing time and 1 minute is setup time (logging in, defining the job). About 20 percent of the jobs need to be reworked, in which case the setup time and the processing time have to be repeated. The remainder of the time, the equipment is idle. What is the OEE of the equipment?arrow_forwardHow do you think we can keep updating Toyota's ideas as new technologies come out and what customers want keeps changing?arrow_forward
- Given how TPS has helped change things in so many fields, do you think there are parts of it that might be hard to use in areas that aren’t about making things, like in healthcare or services? If so, why do you think that might be?arrow_forwardDo you feel there is anything positive about rework?arrow_forwardDo you think technology can achieve faster setup times? How would it be implemented in the hospital workforce?arrow_forward
- In your experience or opinion, do you think process changes like organizing workspaces make a bigger difference, or is investing in technology usually the better solution for faster setups?arrow_forwardHave you seen rework done in your business, and what was done to prevent that from occurring again?arrow_forwardResearch a company different than case studies examined and search the internet and find an example of a business that had to rework a process. How was the organization affected to rework a process in order to restore a good flow unit? Did rework hurt a process or improve the organization's operational efficiency? • Note: Include a reference with supportive citations in the discussion reply in your post.arrow_forward
- Setup time is very important in affecting a process and the capacity of a process. How do you reduce setup time? Give examples of reducing setup time. Please Provide a referenecearrow_forwardDo you think TPS was successful? If so, how? Are there other companies that have used TPS? If so, give examples. Please provide a referencearrow_forwardGiven the significant impact on finances, production timelines, and even equipment functionality, as you pointed out, what do you believe is the most effective single strategy a company can implement to significantly reduce the occurrence of rework within their operations?arrow_forward
 Purchasing and Supply Chain ManagementOperations ManagementISBN:9781285869681Author:Robert M. Monczka, Robert B. Handfield, Larry C. Giunipero, James L. PattersonPublisher:Cengage Learning
 MarketingMarketingISBN:9780357033791Author:Pride, William MPublisher:South Western Educational Publishing
 Contemporary MarketingMarketingISBN:9780357033777Author:Louis E. Boone, David L. KurtzPublisher:Cengage Learning
 Practical Management ScienceOperations ManagementISBN:9781337406659Author:WINSTON, Wayne L.Publisher:Cengage,