
Concept explainers
Videos
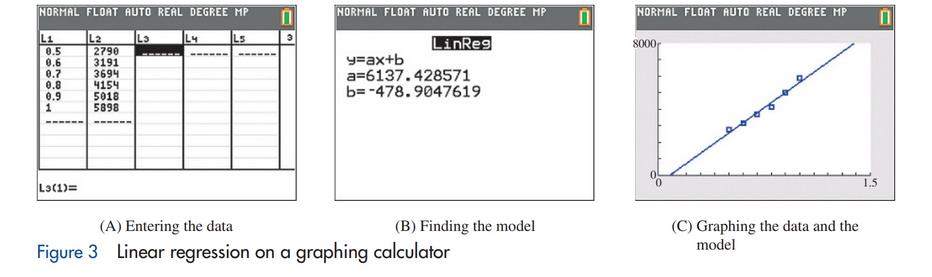
As stated previously, we used linear regression to produce the model in Example 3. If you have a graphing calculator that supports linear regression, then you can find this model. The linear regression process varies greatly from one calculator to another. Consult the user’s manual for the details of linear regression. The screens in Figure 3 are related to the construction of the model in Example 3 on a Texas Instruments TI-84 Plus CE.
(A) Produce similar screens on your graphing calculator.
(B) Do the same for Matched Problem 3.
Want to see the full answer?
Check out a sample textbook solution
Chapter 1 Solutions
EP FINITE MATH.F/BUS,ECON,LIFE..-ACCESS
Additional Math Textbook Solutions
College Algebra (7th Edition)
Intro Stats, Books a la Carte Edition (5th Edition)
Pre-Algebra Student Edition
Elementary Statistics: Picturing the World (7th Edition)
Algebra and Trigonometry (6th Edition)
Calculus: Early Transcendentals (2nd Edition)


- x-4 For the function f(x): find f'(x), the third derivative of f, and f(4) (x), the fourth derivative of f. x+7arrow_forwardIn x For the function f(x) = find f'(x). Then find f''(0) and f''(9). 11x'arrow_forwardLet f(x) = √√x+3 and g(x) = 6x − 2. Find each of the following composite functions and state the domain: (a) fog (b) gof, (c) fof (d) gogarrow_forward
- Compute the following: (a) 8x³ + 3x dx (b) cos(2u) du (c) f² ebx dxarrow_forwardFind the following limits. (a) lim 3(x-1)² x→2 x (b) lim 0+x (c) lim 3x2-x+1 x²+3 x²+x-12 x-3 x-3arrow_forwardFor f(x) = (x+3)² - 2 sketch f(x), f(x), f(x − 2), and f(x) — 2. State the coordi- nates of the turning point in each graph.arrow_forward
- if the b coloumn of a z table disappeared what would be used to determine b column probabilitiesarrow_forwardConstruct a model of population flow between metropolitan and nonmetropolitan areas of a given country, given that their respective populations in 2015 were 263 million and 45 million. The probabilities are given by the following matrix. (from) (to) metro nonmetro 0.99 0.02 metro 0.01 0.98 nonmetro Predict the population distributions of metropolitan and nonmetropolitan areas for the years 2016 through 2020 (in millions, to four decimal places). (Let x, through x5 represent the years 2016 through 2020, respectively.) x₁ = x2 X3 261.27 46.73 11 259.59 48.41 11 257.96 50.04 11 256.39 51.61 11 tarrow_forwardFill in all the justifications to complete this formal proof, following all conventions from the textbook. 1. Ax~Q(x) 2. Ax(Q(x)vR(x)) 3. @n Premise Premise 4. | ~Q(n) 5. | Q(n)vR(n) 6. || Q(n) 7. || # 8. || R(n) 9. || R(n) 10. | R(n) 11. AxR(x)arrow_forward
- For f(x) = (x+3)² - 2 sketch f(x), f(x), f(x − 2), and f(x) — 2. State the coordi- nates of the turning point in each graph.arrow_forwardIn quadrilateral QRST, m<R=60, m<T=90, QR=RS, ST=8, TQ=8 How long is the longer diagonal of QRST? Find the ratio of RT to QS.arrow_forwardNo chatgpt pls will upvotearrow_forward


 Algebra & Trigonometry with Analytic GeometryAlgebraISBN:9781133382119Author:SwokowskiPublisher:Cengage
 Linear Algebra: A Modern IntroductionAlgebraISBN:9781285463247Author:David PoolePublisher:Cengage Learning
 Glencoe Algebra 1, Student Edition, 9780079039897...AlgebraISBN:9780079039897Author:CarterPublisher:McGraw Hill
 Algebra and Trigonometry (MindTap Course List)AlgebraISBN:9781305071742Author:James Stewart, Lothar Redlin, Saleem WatsonPublisher:Cengage Learning