
Pearson eText for Basic Business Statistics -- Instant Access (Pearson+)
14th Edition
ISBN: 9780137400119
Author: MARK BERENSON, David Levine
Publisher: PEARSON+
expand_more
expand_more
format_list_bulleted
Concept explainers
Videos
Textbook Question
Chapter 13, Problem 24PS
The following results show the
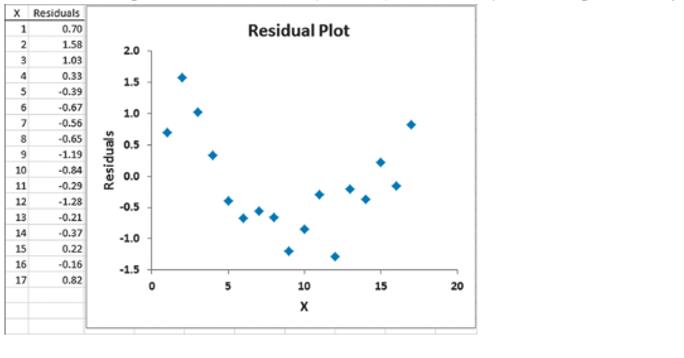
Is there any evidence of a pattern in the residuals? Explain.
Expert Solution & Answer
Want to see the full answer?
Check out a sample textbook solution
Students have asked these similar questions
4. Linear Regression - Model Assumptions and Interpretation
A real estate analyst is studying how house prices (Y) are related to house size in square feet (X). A simple
linear regression model is proposed:
The analyst fits the model and obtains:
•
Ŷ50,000+150X
YBoB₁X + €
•
R² = 0.76
• Residuals show a fan-shaped pattern when plotted against fitted values.
Questions:
a) Interpret the slope coefficient in context.
b) Explain what the R² value tells us about the model's performance.
c) Based on the residual pattern, what regression assumption is likely violated? What might be the
consequence?
d) Suggest at least two remedies to improve the model, based on the residual analysis.
5. Probability Distributions – Continuous Random Variables
A factory machine produces metal rods whose lengths (in cm) follow a continuous uniform distribution on the interval [98, 102].
Questions:
a) Define the probability density function (PDF) of the rod length.b) Calculate the probability that a randomly selected rod is shorter than 99 cm.c) Determine the expected value and variance of rod lengths.d) If a sample of 25 rods is selected, what is the probability that their average length is between 99.5 cm and 100.5 cm? Justify your answer using the appropriate distribution.
2. Hypothesis Testing - Two Sample Means
A nutritionist is investigating the effect of two different diet programs, A and B, on weight loss. Two
independent samples of adults were randomly assigned to each diet for 12 weeks. The weight losses (in kg)
are normally distributed.
Sample A: n = 35, 4.8, s = 1.2
Sample B: n=40, 4.3, 8 = 1.0
Questions:
a) State the null and alternative hypotheses to test whether there is a significant difference in mean weight
loss between the two diet programs.
b) Perform a hypothesis test at the 5% significance level and interpret the result.
c) Compute a 95% confidence interval for the difference in means and interpret it.
d) Discuss assumptions of this test and explain how violations of these assumptions could impact the results.
Chapter 13 Solutions
Pearson eText for Basic Business Statistics -- Instant Access (Pearson+)
Ch. 13 - Prob. 1PSCh. 13 - If the values of X in Problem 13.1 from 2 to 25,...Ch. 13 - Fitting a straight line to a set data yields the...Ch. 13 - The production of wine is a multibillion-dollar...Ch. 13 - Zagat’s publisher restaurant rating for various...Ch. 13 - Is an MBA a golden ticket? Pursuing an MBA is a...Ch. 13 - Starbucks Coffee Co. uses a data-based approach to...Ch. 13 - The value of a sports franchise is directly...Ch. 13 - An agent for a residential real estate company in...Ch. 13 - A box office analyst seeks to predict opening...
Ch. 13 - How do you interpret a coefficient by of...Ch. 13 - If SSR= 36 and SSE=4, determine SST and then...Ch. 13 - If SSR=66 and SST=88, Compute the coefficient of...Ch. 13 - If SSE= 10 and SSR=30, compute the coefficient of...Ch. 13 - If SSR=120, Why is it impossible for SST to equal...Ch. 13 - In problem 13.4 on page 493, the percentage of...Ch. 13 - In problem 13.5 on page 493, you used the summated...Ch. 13 - In Problem 13.6 on page 494, a prospective MBA...Ch. 13 - In Problem 13.7 on page 494, you used the plate...Ch. 13 - In problem 13.8 on page 494, you used annual...Ch. 13 - In problem 13.9 on page 494, an agent for a real...Ch. 13 - In problem 13.10 on page 494, you used You tube...Ch. 13 - The following results provide the X Values,...Ch. 13 - The following results show the X Values,...Ch. 13 - In problem 13.5 on page 493, you used the summated...Ch. 13 - In problem 13.4 on page 493, you used the...Ch. 13 - In problem 13.7 on page 494, you used the plate...Ch. 13 - In problem 13.6 on page 494, a prospective MBA...Ch. 13 - In problem 13.9 on page 494, an agent for a real...Ch. 13 - Prob. 30PSCh. 13 - Prob. 31PSCh. 13 - The residuals for 10 consecutive time periods are...Ch. 13 - The residuals for 15 consecutive time periods are...Ch. 13 - In Problem 13.7 on page 494 concerning the...Ch. 13 - What is the relationship between the price of...Ch. 13 - Prob. 36PSCh. 13 - A freshly brewed shot of espresso has three...Ch. 13 - The owners of a chain of ice cream stores have the...Ch. 13 - You are testing the null hypothesis that there is...Ch. 13 - Prob. 40PSCh. 13 - Prob. 41PSCh. 13 - In problem 13.4 on page 493, you used the...Ch. 13 - Prob. 43PSCh. 13 - In problem 13.6 on page 494, a prospective MBA...Ch. 13 - In Problem 13.7 on page 494, you used the plate...Ch. 13 - Prob. 46PSCh. 13 - In Problem 13.9 on page 494, an agent for a real...Ch. 13 - In Problem 13.10 on page 494, you used you used...Ch. 13 - The volatility of a stock is often measured by its...Ch. 13 - Prob. 50PSCh. 13 - Prob. 51PSCh. 13 - Movie companies need to predict the gross receipts...Ch. 13 - Prob. 53PSCh. 13 - Prob. 54PSCh. 13 - Prob. 55PSCh. 13 - Based on a sample of n=20, the latest-squares...Ch. 13 - Prob. 57PSCh. 13 - In Problem 13.4 on page 493, you used the...Ch. 13 - In Problem 13.7 on page 494, you used the plate...Ch. 13 - In Problem 13.6 on page 494, a prospective MBA...Ch. 13 - Prob. 61PSCh. 13 - Prob. 62PSCh. 13 - In problem 13.10 on page 494, you used YouTube...Ch. 13 - Prob. 64PSCh. 13 - Prob. 65PSCh. 13 - When is the unexplained variation (i.e., error sum...Ch. 13 - Prob. 67PSCh. 13 - Prob. 68PSCh. 13 - Prob. 69PSCh. 13 - How do you evaluate the assumptions of regression...Ch. 13 - When and how do you use the Durbin-Watson...Ch. 13 - Prob. 72PSCh. 13 - Can you use movie critics’ opinions to forecast...Ch. 13 - Management of a soft-drink botting company has the...Ch. 13 - Measuring the height of a California redwood tree...Ch. 13 - You want to develop a model to predict the asking...Ch. 13 - You want to develop a model to predict the taxes...Ch. 13 - An analyst has the objective of predicting the...Ch. 13 - An accountant for a large department store has the...Ch. 13 - On January 28, 1986, the space shuttle Challenger...Ch. 13 - A baseball analyst would like to study various...Ch. 13 - Can you use the annual revenues generated by...Ch. 13 - In Problem 13.82 you used annual revenue to...Ch. 13 - During the fall harvest season in the United...Ch. 13 - Refer to the discussion of beta values and market...Ch. 13 - The file CEO 2016 includes the total compensation...Ch. 13 - In Problem 13.8, 13.20, 13.30, 13.46, 13.62,...
Knowledge Booster


Learn more about
Need a deep-dive on the concept behind this application? Look no further. Learn more about this topic, statistics and related others by exploring similar questions and additional content below.Similar questions
- 1. Sampling Distribution and the Central Limit Theorem A company produces batteries with a mean lifetime of 300 hours and a standard deviation of 50 hours. The lifetimes are not normally distributed—they are right-skewed due to some batteries lasting unusually long. Suppose a quality control analyst selects a random sample of 64 batteries from a large production batch. Questions: a) Explain whether the distribution of sample means will be approximately normal. Justify your answer using the Central Limit Theorem. b) Compute the mean and standard deviation of the sampling distribution of the sample mean. c) What is the probability that the sample mean lifetime of the 64 batteries exceeds 310 hours? d) Discuss how the sample size affects the shape and variability of the sampling distribution.arrow_forwardA biologist is investigating the effect of potential plant hormones by treating 20 stem segments. At the end of the observation period he computes the following length averages: Compound X = 1.18 Compound Y = 1.17 Based on these mean values he concludes that there are no treatment differences. 1) Are you satisfied with his conclusion? Why or why not? 2) If he asked you for help in analyzing these data, what statistical method would you suggest that he use to come to a meaningful conclusion about his data and why? 3) Are there any other questions you would ask him regarding his experiment, data collection, and analysis methods?arrow_forwardBusinessarrow_forward
- What is the solution and answer to question?arrow_forwardTo: [Boss's Name] From: Nathaniel D Sain Date: 4/5/2025 Subject: Decision Analysis for Business Scenario Introduction to the Business Scenario Our delivery services business has been experiencing steady growth, leading to an increased demand for faster and more efficient deliveries. To meet this demand, we must decide on the best strategy to expand our fleet. The three possible alternatives under consideration are purchasing new delivery vehicles, leasing vehicles, or partnering with third-party drivers. The decision must account for various external factors, including fuel price fluctuations, demand stability, and competition growth, which we categorize as the states of nature. Each alternative presents unique advantages and challenges, and our goal is to select the most viable option using a structured decision-making approach. Alternatives and States of Nature The three alternatives for fleet expansion were chosen based on their cost implications, operational efficiency, and…arrow_forwardBusinessarrow_forward
- Why researchers are interested in describing measures of the center and measures of variation of a data set?arrow_forwardWHAT IS THE SOLUTION?arrow_forwardThe following ordered data list shows the data speeds for cell phones used by a telephone company at an airport: A. Calculate the Measures of Central Tendency from the ungrouped data list. B. Group the data in an appropriate frequency table. C. Calculate the Measures of Central Tendency using the table in point B. 0.8 1.4 1.8 1.9 3.2 3.6 4.5 4.5 4.6 6.2 6.5 7.7 7.9 9.9 10.2 10.3 10.9 11.1 11.1 11.6 11.8 12.0 13.1 13.5 13.7 14.1 14.2 14.7 15.0 15.1 15.5 15.8 16.0 17.5 18.2 20.2 21.1 21.5 22.2 22.4 23.1 24.5 25.7 28.5 34.6 38.5 43.0 55.6 71.3 77.8arrow_forward
- II Consider the following data matrix X: X1 X2 0.5 0.4 0.2 0.5 0.5 0.5 10.3 10 10.1 10.4 10.1 10.5 What will the resulting clusters be when using the k-Means method with k = 2. In your own words, explain why this result is indeed expected, i.e. why this clustering minimises the ESS map.arrow_forwardwhy the answer is 3 and 10?arrow_forwardPS 9 Two films are shown on screen A and screen B at a cinema each evening. The numbers of people viewing the films on 12 consecutive evenings are shown in the back-to-back stem-and-leaf diagram. Screen A (12) Screen B (12) 8 037 34 7 6 4 0 534 74 1645678 92 71689 Key: 116|4 represents 61 viewers for A and 64 viewers for B A second stem-and-leaf diagram (with rows of the same width as the previous diagram) is drawn showing the total number of people viewing films at the cinema on each of these 12 evenings. Find the least and greatest possible number of rows that this second diagram could have. TIP On the evening when 30 people viewed films on screen A, there could have been as few as 37 or as many as 79 people viewing films on screen B.arrow_forward
arrow_back_ios
SEE MORE QUESTIONS
arrow_forward_ios
Recommended textbooks for you
 Functions and Change: A Modeling Approach to Coll...AlgebraISBN:9781337111348Author:Bruce Crauder, Benny Evans, Alan NoellPublisher:Cengage Learning
 Glencoe Algebra 1, Student Edition, 9780079039897...AlgebraISBN:9780079039897Author:CarterPublisher:McGraw Hill
 Big Ideas Math A Bridge To Success Algebra 1: Stu...AlgebraISBN:9781680331141Author:HOUGHTON MIFFLIN HARCOURTPublisher:Houghton Mifflin Harcourt
 College AlgebraAlgebraISBN:9781305115545Author:James Stewart, Lothar Redlin, Saleem WatsonPublisher:Cengage Learning
 Algebra and Trigonometry (MindTap Course List)AlgebraISBN:9781305071742Author:James Stewart, Lothar Redlin, Saleem WatsonPublisher:Cengage Learning
Functions and Change: A Modeling Approach to Coll...
Algebra
ISBN:9781337111348
Author:Bruce Crauder, Benny Evans, Alan Noell
Publisher:Cengage Learning
Glencoe Algebra 1, Student Edition, 9780079039897...
Algebra
ISBN:9780079039897
Author:Carter
Publisher:McGraw Hill
Big Ideas Math A Bridge To Success Algebra 1: Stu...
Algebra
ISBN:9781680331141
Author:HOUGHTON MIFFLIN HARCOURT
Publisher:Houghton Mifflin Harcourt
College Algebra
Algebra
ISBN:9781305115545
Author:James Stewart, Lothar Redlin, Saleem Watson
Publisher:Cengage Learning
Algebra and Trigonometry (MindTap Course List)
Algebra
ISBN:9781305071742
Author:James Stewart, Lothar Redlin, Saleem Watson
Publisher:Cengage Learning
Correlation Vs Regression: Difference Between them with definition & Comparison Chart; Author: Key Differences;https://www.youtube.com/watch?v=Ou2QGSJVd0U;License: Standard YouTube License, CC-BY
Correlation and Regression: Concepts with Illustrative examples; Author: LEARN & APPLY : Lean and Six Sigma;https://www.youtube.com/watch?v=xTpHD5WLuoA;License: Standard YouTube License, CC-BY