Subpart (a):
Marginal revenue.
Subpart (a):
Explanation of Solution
In case A, part (I):
Marginal revenue equation can be derived as follows:
Marginal revenue equation is 50-2Q.
When the quantity is 0 units, the marginal revenue can be calculated by substituting the respective values in the marginal revenue equation.
Marginal revenue is 50 at the point where the quantity is 0 units.
When the quantity is 25 units, the marginal revenue can be calculated by substituting the respective values in the marginal revenue equation.
Marginal revenue is 0 at the point where the quantity is 50 units.
Figure 1 illustrates the marginal revenue curve for 50-2Q.
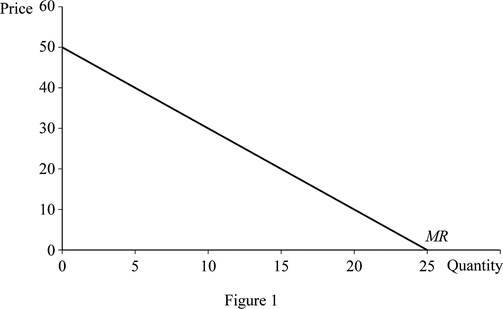
In Figure 1, the vertical axis measures price and the horizontal axis measures quantity; when the quantity is zero, the price would be 50. At price zero, the quantity demanded is 25; thus, this joins the two points the marginal revenue curve gets.
In case A, part (II):
The profit-maximizing output can be calculated by equating the marginal revenue to the marginal cost. This can be done as follows:
Profit-maximizing output is 20 units.
In case A, part (III):
Substitute the profit-maximizing output in the
Profit-maximizing price is $30.
In case A, part (IV):
Total revenue can be obtained by multiplying the profit-maximizing price with the profit-maximizing quantity. This can be done as follows:
Total revenue is $600.
Total cost can be calculated as follows:
Total cost is $300.
In case A, part (V):
Profit can be calculated as follows:
Profit is $300.
In case B, part (I):
Marginal revenue equation can be derived as follows:
Marginal revenue equation is 100-4Q.
When quantity is 0 units, the marginal revenue can be calculated by substituting the respective values in the marginal revenue equation.
Marginal revenue is 100 at the point where the quantity is 0 units.
When quantity is 25 units, the marginal revenue can be calculated by substituting the respective values in the marginal revenue equation.
Marginal revenue is 0 at the point where the quantity is 50 units.
Figure 2 illustrates the marginal revenue curve for 100-4Q.
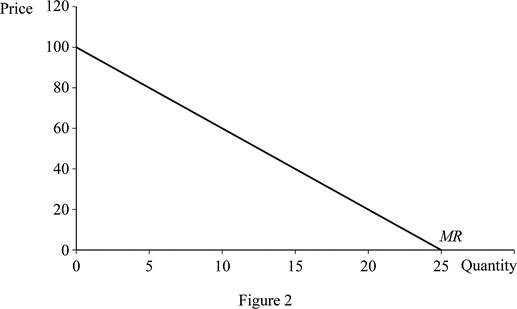
In Figure 2, the vertical axis measures price and the horizontal axis measures quantity. When the quantity is zero, the price would be 100, and at price zero, the quantity demanded is 25. Thus, joining the two points can help obtain the marginal revenue curve.
In case B, part (II):
Profit-maximizing output can be calculated by equating the marginal revenue to the marginal cost. This can be done as follows:
Profit-maximizing output is 22.5 units.
In case B, part (III):
Substitute the profit-maximizing output in the demand equation to calculate the profit maximizing price.
Profit-maximizing price is $55.
In case B, part (IV):
Total revenue can be obtained by multiplying the profit-maximizing price with profit-maximizing quantity. This can be done as follows:
Total revenue is $1,237.5.
Total cost can be calculated as follows:
Total cost is $325.
In case B, part (V):
Profit can be calculated as follows:
Profit is $912.5.
In case C, part (I):
Marginal revenue equation can be derived as follows:
Marginal revenue equation is 100-4Q.
When the quantity is 0 units, the marginal revenue can be calculated by substituting the respective values in the marginal revenue equation.
Marginal revenue is 100 at the point where the quantity is 0 units.
When the quantity is 25 units, the marginal revenue can be calculated by substituting the respective values in the marginal revenue equation.
Marginal revenue is 0 at the point where the quantity is 50 units.
Figure 3 illustrates the marginal revenue curve for100-4Q.
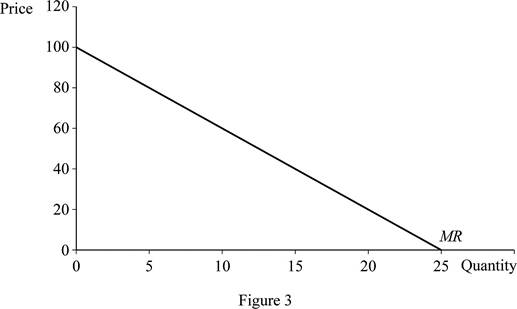
In Figure 3, the vertical axis measures price and the horizontal axis measures quantity. When the quantity is zero, the price would be 100, and at price zero, the quantity demanded is 25. Thus, joining the two points can help obtain the marginal revenue curve.
In case C, part (II):
Profit-maximizing output can be calculated by equating marginal revenue to the marginal cost. This can be done as follows:
Profit-maximizing output is 20 units.
In case C, part (III):
Substitute the profit-maximizing output in demand equation to calculate the profit-maximizing price.
Profit-maximizing price is $60.
In case C, part (IV):
Total revenue can be obtained by multiplying the profit-maximizing price with profit-maximizing quantity. This can be done as follows:
Total revenue is $1,200.
Total cost can be calculated as follows:
Total cost is $500.
In case C, part (V):
Profit can be calculated as follows:
Profit is $700.
Concept introduction:
Marginal revenue: The change in total revenue from selling an additional unit is known as marginal revenue.
Mark-up: Mark-up refers to the amount that is added by the seller to the cost of the goods to determine the selling price.
Sub part (b):
Marginal revenue.
Sub part (b):
Explanation of Solution
The markup refers to the amount that is added by the seller to the cost of the goods to determine the selling price. For calculating the percentage markup, the following equation can be used:
Case A:
Using equation (1), the percentage mark-up in case A can be calculated as follows:
The percentage mark-up in price $20 is 200%.
Case B:
To calculate the percentage mark-up in case B, substitute the values in equation (1).
The percentage mark-up in price $45 is 450%.
Case C:
To calculate the percentage mark-up in case C, substitute the values in equation (1).
The percentage mark-up in price $40 is 200%.
Concept introduction:
Marginal revenue: The change in total revenue from selling an additional unit is known as marginal revenue.
Mark-up: Mark-up refers to the amount that is added by the seller to the cost of the goods to determine the selling price.
Sub part (c):
Marginal revenue.
Sub part (c):
Explanation of Solution
If
Want to see more full solutions like this?
Chapter 13 Solutions
Modern Principles of Economics

- Answerarrow_forwardM” method Given the following model, solve by the method of “M”. (see image)arrow_forwardAs indicated in the attached image, U.S. earnings for high- and low-skill workers as measured by educational attainment began diverging in the 1980s. The remaining questions in this problem set use the model for the labor market developed in class to walk through potential explanations for this trend. 1. Assume that there are just two types of workers, low- and high-skill. As a result, there are two labor markets: supply and demand for low-skill workers and supply and demand for high-skill workers. Using two carefully drawn labor-market figures, show that an increase in the demand for high skill workers can explain an increase in the relative wage of high-skill workers. 2. Using the same assumptions as in the previous question, use two carefully drawn labor-market figures to show that an increase in the supply of low-skill workers can explain an increase in the relative wage of high-skill workers.arrow_forward
- Published in 1980, the book Free to Choose discusses how economists Milton Friedman and Rose Friedman proposed a one-sided view of the benefits of a voucher system. However, there are other economists who disagree about the potential effects of a voucher system.arrow_forwardThe following diagram illustrates the demand and marginal revenue curves facing a monopoly in an industry with no economies or diseconomies of scale. In the short and long run, MC = ATC. a. Calculate the values of profit, consumer surplus, and deadweight loss, and illustrate these on the graph. b. Repeat the calculations in part a, but now assume the monopoly is able to practice perfect price discrimination.arrow_forwardThe projects under the 'Build, Build, Build' program: how these projects improve connectivity and ease of doing business in the Philippines?arrow_forward

 Principles of Economics (12th Edition)EconomicsISBN:9780134078779Author:Karl E. Case, Ray C. Fair, Sharon E. OsterPublisher:PEARSON
 Engineering Economy (17th Edition)EconomicsISBN:9780134870069Author:William G. Sullivan, Elin M. Wicks, C. Patrick KoellingPublisher:PEARSON
 Principles of Economics (MindTap Course List)EconomicsISBN:9781305585126Author:N. Gregory MankiwPublisher:Cengage Learning
 Managerial Economics: A Problem Solving ApproachEconomicsISBN:9781337106665Author:Luke M. Froeb, Brian T. McCann, Michael R. Ward, Mike ShorPublisher:Cengage Learning
 Managerial Economics & Business Strategy (Mcgraw-...EconomicsISBN:9781259290619Author:Michael Baye, Jeff PrincePublisher:McGraw-Hill Education