Subpart (a):
Marginal revenue.
Subpart (a):
Explanation of Solution
In case A, part (I):
Marginal revenue equation can be derived as follows:
Marginal revenue equation is 50-2Q.
When the quantity is 0 units, the marginal revenue can be calculated by substituting the respective values in the marginal revenue equation.
Marginal revenue is 50 at the point where the quantity is 0 units.
When the quantity is 25 units, the marginal revenue can be calculated by substituting the respective values in the marginal revenue equation.
Marginal revenue is 0 at the point where the quantity is 50 units.
Figure 1 illustrates the marginal revenue curve for 50-2Q.
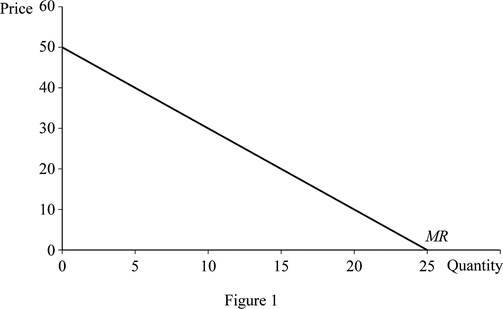
In Figure 1, the vertical axis measures price and the horizontal axis measures quantity; when the quantity is zero, the price would be 50. At price zero, the quantity demanded is 25; thus, this joins the two points the marginal revenue curve gets.
In case A, part (II):
The profit-maximizing output can be calculated by equating the marginal revenue to the marginal cost. This can be done as follows:
Profit-maximizing output is 20 units.
In case A, part (III):
Substitute the profit-maximizing output in the
Profit-maximizing price is $30.
In case A, part (IV):
Total revenue can be obtained by multiplying the profit-maximizing price with the profit-maximizing quantity. This can be done as follows:
Total revenue is $600.
Total cost can be calculated as follows:
Total cost is $300.
In case A, part (V):
Profit can be calculated as follows:
Profit is $300.
In case B, part (I):
Marginal revenue equation can be derived as follows:
Marginal revenue equation is 100-4Q.
When quantity is 0 units, the marginal revenue can be calculated by substituting the respective values in the marginal revenue equation.
Marginal revenue is 100 at the point where the quantity is 0 units.
When quantity is 25 units, the marginal revenue can be calculated by substituting the respective values in the marginal revenue equation.
Marginal revenue is 0 at the point where the quantity is 50 units.
Figure 2 illustrates the marginal revenue curve for 100-4Q.
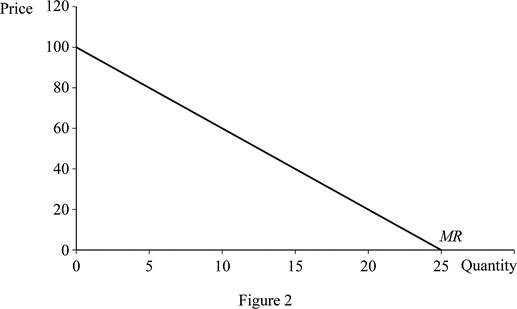
In Figure 2, the vertical axis measures price and the horizontal axis measures quantity. When the quantity is zero, the price would be 100, and at price zero, the quantity demanded is 25. Thus, joining the two points can help obtain the marginal revenue curve.
In case B, part (II):
Profit-maximizing output can be calculated by equating the marginal revenue to the marginal cost. This can be done as follows:
Profit-maximizing output is 22.5 units.
In case B, part (III):
Substitute the profit-maximizing output in the demand equation to calculate the profit maximizing price.
Profit-maximizing price is $55.
In case B, part (IV):
Total revenue can be obtained by multiplying the profit-maximizing price with profit-maximizing quantity. This can be done as follows:
Total revenue is $1,237.5.
Total cost can be calculated as follows:
Total cost is $325.
In case B, part (V):
Profit can be calculated as follows:
Profit is $912.5.
In case C, part (I):
Marginal revenue equation can be derived as follows:
Marginal revenue equation is 100-4Q.
When the quantity is 0 units, the marginal revenue can be calculated by substituting the respective values in the marginal revenue equation.
Marginal revenue is 100 at the point where the quantity is 0 units.
When the quantity is 25 units, the marginal revenue can be calculated by substituting the respective values in the marginal revenue equation.
Marginal revenue is 0 at the point where the quantity is 50 units.
Figure 3 illustrates the marginal revenue curve for100-4Q.
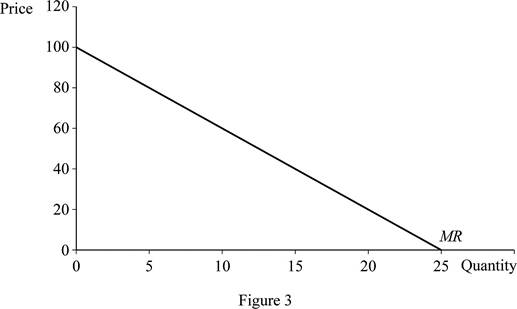
In Figure 3, the vertical axis measures price and the horizontal axis measures quantity. When the quantity is zero, the price would be 100, and at price zero, the quantity demanded is 25. Thus, joining the two points can help obtain the marginal revenue curve.
In case C, part (II):
Profit-maximizing output can be calculated by equating marginal revenue to the marginal cost. This can be done as follows:
Profit-maximizing output is 20 units.
In case C, part (III):
Substitute the profit-maximizing output in demand equation to calculate the profit-maximizing price.
Profit-maximizing price is $60.
In case C, part (IV):
Total revenue can be obtained by multiplying the profit-maximizing price with profit-maximizing quantity. This can be done as follows:
Total revenue is $1,200.
Total cost can be calculated as follows:
Total cost is $500.
In case C, part (V):
Profit can be calculated as follows:
Profit is $700.
Concept introduction:
Marginal revenue: The change in total revenue from selling an additional unit is known as marginal revenue.
Mark-up: Mark-up refers to the amount that is added by the seller to the cost of the goods to determine the selling price.
Sub part (b):
Marginal revenue.
Sub part (b):
Explanation of Solution
The markup refers to the amount that is added by the seller to the cost of the goods to determine the selling price. For calculating the percentage markup, the following equation can be used:
Case A:
Using equation (1), the percentage mark-up in case A can be calculated as follows:
The percentage mark-up in price $20 is 200%.
Case B:
To calculate the percentage mark-up in case B, substitute the values in equation (1).
The percentage mark-up in price $45 is 450%.
Case C:
To calculate the percentage mark-up in case C, substitute the values in equation (1).
The percentage mark-up in price $40 is 200%.
Concept introduction:
Marginal revenue: The change in total revenue from selling an additional unit is known as marginal revenue.
Mark-up: Mark-up refers to the amount that is added by the seller to the cost of the goods to determine the selling price.
Sub part (c):
Marginal revenue.
Sub part (c):
Explanation of Solution
If
Want to see more full solutions like this?
Chapter 13 Solutions
Modern Principles of Economics

- 17. Given that C=$700+0.8Y, I=$300, G=$600, what is Y if Y=C+I+G?arrow_forwardUse the Feynman technique throughout. Assume that you’re explaining the answer to someone who doesn’t know the topic at all. Write explanation in paragraphs and if you use currency use USD currency: 10. What is the mechanism or process that allows the expenditure multiplier to “work” in theKeynesian Cross Model? Explain and show both mathematically and graphically. What isthe underpinning assumption for the process to transpire?arrow_forwardUse the Feynman technique throughout. Assume that you’reexplaining the answer to someone who doesn’t know the topic at all. Write it all in paragraphs: 2. Give an overview of the equation of exchange (EoE) as used by Classical Theory. Now,carefully explain each variable in the EoE. What is meant by the “quantity theory of money”and how is it different from or the same as the equation of exchange?arrow_forward
- Zbsbwhjw8272:shbwhahwh Zbsbwhjw8272:shbwhahwh Zbsbwhjw8272:shbwhahwhZbsbwhjw8272:shbwhahwhZbsbwhjw8272:shbwhahwharrow_forwardUse the Feynman technique throughout. Assume that you’re explaining the answer to someone who doesn’t know the topic at all:arrow_forwardUse the Feynman technique throughout. Assume that you’reexplaining the answer to someone who doesn’t know the topic at all: 4. Draw a Keynesian AD curve in P – Y space and list the shift factors that will shift theKeynesian AD curve upward and to the right. Draw a separate Classical AD curve in P – Yspace and list the shift factors that will shift the Classical AD curve upward and to the right.arrow_forward
- Use the Feynman technique throughout. Assume that you’re explaining the answer to someone who doesn’t know the topic at all: 10. What is the mechanism or process that allows the expenditure multiplier to “work” in theKeynesian Cross Model? Explain and show both mathematically and graphically. What isthe underpinning assumption for the process to transpire?arrow_forwardUse the Feynman technique throughout. Assume that you’re explaining the answer to someone who doesn’t know the topic at all: 15. How is the Keynesian expenditure multiplier implicit in the Keynesian version of the AD/ASmodel? Explain and show mathematically. (note: this is a tough one)arrow_forwardUse the Feynman technique throughout. Assume that you’re explaining the answer to someone who doesn’t know the topic at all: 13. What would happen to the net exports function in Europe and the US respectively if thedemand for dollars rises worldwide? Explain why.arrow_forward

 Principles of Economics (12th Edition)EconomicsISBN:9780134078779Author:Karl E. Case, Ray C. Fair, Sharon E. OsterPublisher:PEARSON
 Engineering Economy (17th Edition)EconomicsISBN:9780134870069Author:William G. Sullivan, Elin M. Wicks, C. Patrick KoellingPublisher:PEARSON
 Principles of Economics (MindTap Course List)EconomicsISBN:9781305585126Author:N. Gregory MankiwPublisher:Cengage Learning
 Managerial Economics: A Problem Solving ApproachEconomicsISBN:9781337106665Author:Luke M. Froeb, Brian T. McCann, Michael R. Ward, Mike ShorPublisher:Cengage Learning
 Managerial Economics & Business Strategy (Mcgraw-...EconomicsISBN:9781259290619Author:Michael Baye, Jeff PrincePublisher:McGraw-Hill Education