
Subpart (a):
Marginal revenue.
Subpart (a):
Explanation of Solution
In case A, part (I):
Marginal revenue equation can be derived as follows:
Marginal revenue equation is 50-2Q.
When the quantity is 0 units, the marginal revenue can be calculated by substituting the respective values in the marginal revenue equation.
Marginal revenue is 50 at the point where the quantity is 0 units.
When the quantity is 25 units, the marginal revenue can be calculated by substituting the respective values in the marginal revenue equation.
Marginal revenue is 0 at the point where the quantity is 50 units.
Figure 1 illustrates the marginal revenue curve for 50-2Q.
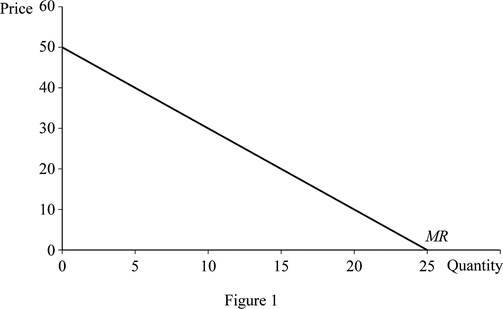
In Figure 1, the vertical axis measures price and the horizontal axis measures quantity; when the quantity is zero, the price would be 50. At price zero, the quantity demanded is 25; thus, this joins the two points the marginal revenue curve gets.
In case A, part (II):
The profit-maximizing output can be calculated by equating the marginal revenue to the marginal cost. This can be done as follows:
Profit-maximizing output is 20 units.
In case A, part (III):
Substitute the profit-maximizing output in the demand equation to calculate the profit-maximizing price.
Profit-maximizing price is $30.
In case A, part (IV):
Total revenue can be obtained by multiplying the profit-maximizing price with the profit-maximizing quantity. This can be done as follows:
Total revenue is $600.
Total cost can be calculated as follows:
Total cost is $300.
In case A, part (V):
Profit can be calculated as follows:
Profit is $300.
In case B, part (I):
Marginal revenue equation can be derived as follows:
Marginal revenue equation is 100-4Q.
When quantity is 0 units, the marginal revenue can be calculated by substituting the respective values in the marginal revenue equation.
Marginal revenue is 100 at the point where the quantity is 0 units.
When quantity is 25 units, the marginal revenue can be calculated by substituting the respective values in the marginal revenue equation.
Marginal revenue is 0 at the point where the quantity is 50 units.
Figure 2 illustrates the marginal revenue curve for 100-4Q.
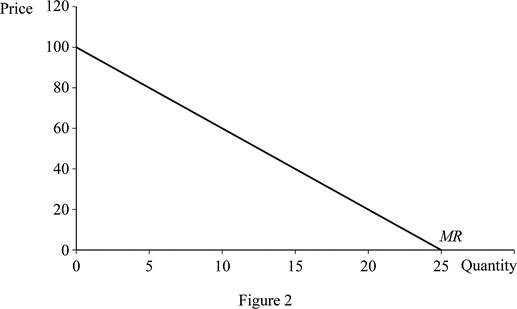
In Figure 2, the vertical axis measures price and the horizontal axis measures quantity. When the quantity is zero, the price would be 100, and at price zero, the quantity demanded is 25. Thus, joining the two points can help obtain the marginal revenue curve.
In case B, part (II):
Profit-maximizing output can be calculated by equating the marginal revenue to the marginal cost. This can be done as follows:
Profit-maximizing output is 22.5 units.
In case B, part (III):
Substitute the profit-maximizing output in the demand equation to calculate the profit maximizing price.
Profit-maximizing price is $55.
In case B, part (IV):
Total revenue can be obtained by multiplying the profit-maximizing price with profit-maximizing quantity. This can be done as follows:
Total revenue is $1,237.5.
Total cost can be calculated as follows:
Total cost is $325.
In case B, part (V):
Profit can be calculated as follows:
Profit is $912.5.
In case C, part (I):
Marginal revenue equation can be derived as follows:
Marginal revenue equation is 100-4Q.
When the quantity is 0 units, the marginal revenue can be calculated by substituting the respective values in the marginal revenue equation.
Marginal revenue is 100 at the point where the quantity is 0 units.
When the quantity is 25 units, the marginal revenue can be calculated by substituting the respective values in the marginal revenue equation.
Marginal revenue is 0 at the point where the quantity is 50 units.
Figure 3 illustrates the marginal revenue curve for100-4Q.
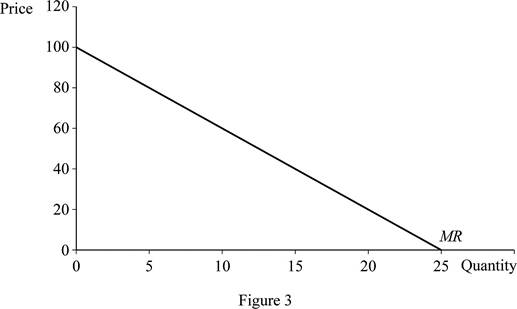
In Figure 3, the vertical axis measures price and the horizontal axis measures quantity. When the quantity is zero, the price would be 100, and at price zero, the quantity demanded is 25. Thus, joining the two points can help obtain the marginal revenue curve.
In case C, part (II):
Profit-maximizing output can be calculated by equating marginal revenue to the marginal cost. This can be done as follows:
Profit-maximizing output is 20 units.
In case C, part (III):
Substitute the profit-maximizing output in demand equation to calculate the profit-maximizing price.
Profit-maximizing price is $60.
In case C, part (IV):
Total revenue can be obtained by multiplying the profit-maximizing price with profit-maximizing quantity. This can be done as follows:
Total revenue is $1,200.
Total cost can be calculated as follows:
Total cost is $500.
In case C, part (V):
Profit can be calculated as follows:
Profit is $700.
Concept introduction:
Marginal revenue: The change in total revenue from selling an additional unit is known as marginal revenue.
Mark-up: Mark-up refers to the amount that is added by the seller to the cost of the goods to determine the selling price.
Sub part (b):
Marginal revenue.
Sub part (b):
Explanation of Solution
The markup refers to the amount that is added by the seller to the cost of the goods to determine the selling price. For calculating the percentage markup, the following equation can be used:
Case A:
Using equation (1), the percentage mark-up in case A can be calculated as follows:
The percentage mark-up in price $20 is 200%.
Case B:
To calculate the percentage mark-up in case B, substitute the values in equation (1).
The percentage mark-up in price $45 is 450%.
Case C:
To calculate the percentage mark-up in case C, substitute the values in equation (1).
The percentage mark-up in price $40 is 200%.
Concept introduction:
Marginal revenue: The change in total revenue from selling an additional unit is known as marginal revenue.
Mark-up: Mark-up refers to the amount that is added by the seller to the cost of the goods to determine the selling price.
Sub part (c):
Marginal revenue.
Sub part (c):
Explanation of Solution
If
Want to see more full solutions like this?
Chapter 13 Solutions
EBK MODERN PRINCIPLES OF ECONOMICS

- what is change in TC / change in Q? and what would be an example?arrow_forwardhow to solve the attachment?arrow_forwardProblem 3-ABC Challenges: Attrition, Balance and ComplianceCan television inform people about public affairs? Political scientists Bethany Albertson and Adria Lawrence (2009) conducted an experiment in which they randomly assigned people to treatment and control groups to evaluate the effect of watching TV on a person’s information level. Those assigned to the treatment group were told to watch a specific television broadcast and were later asked questions related to what they watched. Those in the controlgroup were not shown the TV broadcast but were asked questions related to the material in the TV broadcast. The dataset contains the following variables: : Dummy variable which =1 if a person reads news and 0 otherwise. : interest in political affairs (not interested=1 to very interested=4) : years of education : female dummy variable (female=1; male=0) : family income in thousands of dollars : information level (low information level=1 to high information level=4) =1 if the…arrow_forward
- Problem 2-Experiments/Randomized Control Trial Suppose you are interested in studying the effect of academic counselling on the years it takes for a student to obtain an undergraduate degree. You conduct a randomized control trial to answer the question. You randomly assign 2500 individuals in a university in New York to receive academic counselling and 2500 students to not receive any academic counselling. a. Which people are a part of the treatment group and which people are a part of thecontrol group? b. What regression will you run? Define the variables where required. c. Suppose you estimate = -0.3. Interpret it. d. You test for balance using the variables mentioned in the table below. Based on the results do you think that the treatment and control group are balanced? If your answer is “yes” then explain why. If your answer is “no”, then explain why and mention how will you address the issue of imbalance. e. Suppose that some unmotivated students in the control group decided to…arrow_forwardHow to calculate total cost?arrow_forwardProblem 1-Experiments/Randomized Control TrialSuppose you are interested in studying the effect of being a part of the labor union on anindividual’s hourly wage.You collect data on 1000 people and run the following regression. where is a dummy variable which is equal t to 1 for people who are a part of labor union and0 for others. a. Suppose you estimate . Interpret b. Do you think is biased or unbiased? Explain. Now suppose you conduct a randomized control trial to answer the same question. Yourandomly assign some individuals to be a part of the labor union and others to not be a partof the labor union. The first step you take is to ensure that the randomization was donecorrectly. Then you estimate the following equation: =1 if the student is assigned to be a part of Labor Union=0 if the student is assigned to not be a part of Labor Union c. Why is it important to ensure that the randomization is done correctly? d. Name any two variables that you can use to test if Treatment and…arrow_forward
- What is kiosk?arrow_forwardIf food is produced in the U.S., sold in the U.S. and consumed in the U.S., a reduction in its price will have which of the following effects ______? Two of the answers are correct. The consumer price index will decrease. None of the answers are correct. The GDP deflator will decrease.arrow_forwardhow to caculate verible cost?arrow_forward
- What is the deficit?arrow_forwardIdentify the two curves shown on the graph, and explain their upward and downward slopes. Why does curve Aintersect the horizontal axis? What is the significance of quantity d? What does erepresent? How would the optimal quantity of information change if the marginal benefit of information increased—that is, if the marginal benefit curve shifted upward?arrow_forward6. Rent seeking The following graph shows the demand, marginal revenue, and marginal cost curves for a single-price monopolist that produces a drug that helps relieve arthritis pain. Place the grey point (star symbol) in the appropriate location on the graph to indicate the monopoly outcome such that the dashed lines reveal the profit-maximizing price and quantity of a single-price monopolist. Then, use the green rectangle (triangle symbols) to show the profits earned by the monopolist. 18 200 20 16 16 14 PRICE (Dollars per dose) 12 10 10 8 4 2 MC = ATC MR Demand 0 0 5 10 15 20 25 30 35 40 45 50 QUANTITY (Millions of doses per year) Monopoly Outcome Monopoly Profits Suppose that should the patent on this particular drug expire, the market would become perfectly competitive, with new firms immediately entering the market with essentially identical products. Further suppose that in this case the original firm will hire lobbyists and make donations to several key politicians to extend its…arrow_forward

 Principles of Economics (12th Edition)EconomicsISBN:9780134078779Author:Karl E. Case, Ray C. Fair, Sharon E. OsterPublisher:PEARSON
 Engineering Economy (17th Edition)EconomicsISBN:9780134870069Author:William G. Sullivan, Elin M. Wicks, C. Patrick KoellingPublisher:PEARSON
 Principles of Economics (MindTap Course List)EconomicsISBN:9781305585126Author:N. Gregory MankiwPublisher:Cengage Learning
 Managerial Economics: A Problem Solving ApproachEconomicsISBN:9781337106665Author:Luke M. Froeb, Brian T. McCann, Michael R. Ward, Mike ShorPublisher:Cengage Learning
 Managerial Economics & Business Strategy (Mcgraw-...EconomicsISBN:9781259290619Author:Michael Baye, Jeff PrincePublisher:McGraw-Hill Education