
a:
Calculate the z value and p value with boys.
a:
Explanation of Solution
The null hypothesis (H0) is
The calculated Z value and p value can be obtained using the statistical software. The result is given below:
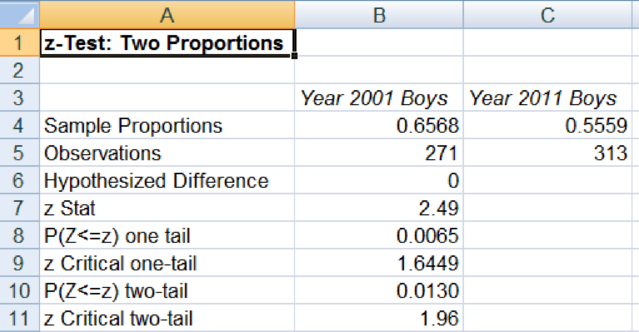
The Z value is 2.49 and the p value is 0.0065. Since the p value is nearly equal to 0, the alternate hypothesis is accepted.
b:
Calculate the z value and p value with girls.
b:
Explanation of Solution
The null hypothesis (H0) is
The calculated Z value and p value can be obtained using the statistical software. The result is given below:
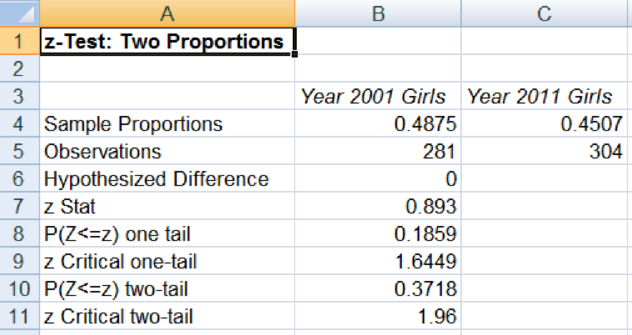
The Z value is 0.893 and the p value is 0.1859. Since the p value is significantly different from 0, the alternate hypothesis is not accepted.
c:
Calculate the z value and p value with boys and girls.
c:
Explanation of Solution
The null hypothesis (H0) is
The calculated Z value and p value can be obtained using the statistical software. The result is given below:
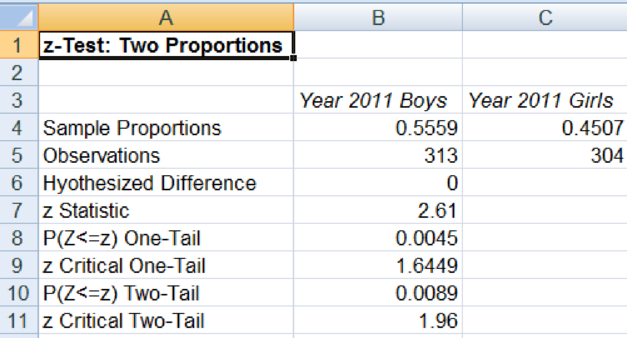
The Z value is 2.61 and the p value is 0.0045. Since the p value is nearly equal to 0, the alternate hypothesis is accepted.
Want to see more full solutions like this?
Chapter 13 Solutions
EBK STATISTICS FOR MANAGEMENT AND ECONO

- Answerarrow_forwardM” method Given the following model, solve by the method of “M”. (see image)arrow_forwardAs indicated in the attached image, U.S. earnings for high- and low-skill workers as measured by educational attainment began diverging in the 1980s. The remaining questions in this problem set use the model for the labor market developed in class to walk through potential explanations for this trend. 1. Assume that there are just two types of workers, low- and high-skill. As a result, there are two labor markets: supply and demand for low-skill workers and supply and demand for high-skill workers. Using two carefully drawn labor-market figures, show that an increase in the demand for high skill workers can explain an increase in the relative wage of high-skill workers. 2. Using the same assumptions as in the previous question, use two carefully drawn labor-market figures to show that an increase in the supply of low-skill workers can explain an increase in the relative wage of high-skill workers.arrow_forward
- Published in 1980, the book Free to Choose discusses how economists Milton Friedman and Rose Friedman proposed a one-sided view of the benefits of a voucher system. However, there are other economists who disagree about the potential effects of a voucher system.arrow_forwardThe following diagram illustrates the demand and marginal revenue curves facing a monopoly in an industry with no economies or diseconomies of scale. In the short and long run, MC = ATC. a. Calculate the values of profit, consumer surplus, and deadweight loss, and illustrate these on the graph. b. Repeat the calculations in part a, but now assume the monopoly is able to practice perfect price discrimination.arrow_forwardThe projects under the 'Build, Build, Build' program: how these projects improve connectivity and ease of doing business in the Philippines?arrow_forward
 Managerial Economics: Applications, Strategies an...EconomicsISBN:9781305506381Author:James R. McGuigan, R. Charles Moyer, Frederick H.deB. HarrisPublisher:Cengage Learning
 Managerial Economics: A Problem Solving ApproachEconomicsISBN:9781337106665Author:Luke M. Froeb, Brian T. McCann, Michael R. Ward, Mike ShorPublisher:Cengage Learning
 Principles of Economics 2eEconomicsISBN:9781947172364Author:Steven A. Greenlaw; David ShapiroPublisher:OpenStax