
MyLab Statistics for Business Stats with Pearson eText -- Standalone Access Card -- for Statistics for Business and Economics
13th Edition
ISBN: 9780134748610
Author: James T. McClave, P. George Benson, Terry Sincich
Publisher: PEARSON
expand_more
expand_more
format_list_bulleted
Videos
Textbook Question
Chapter 13, Problem 13.85ACB
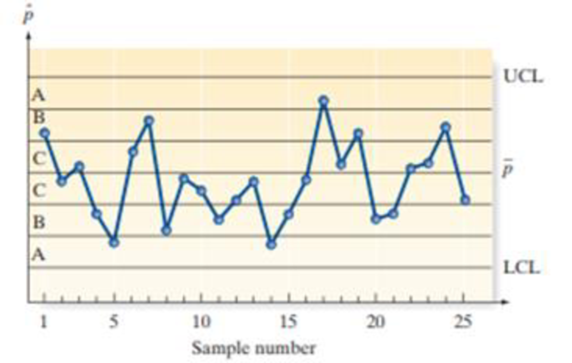
Applying pattern-analysis rules. Use the appropriate pattern-analysis rules to determine whether the process being monitored by the following control chart is under the influence of special causes of variation.
Expert Solution & Answer
Want to see the full answer?
Check out a sample textbook solution
Students have asked these similar questions
BUSINESS DISCUSS
A researcher wishes to estimate, with 90% confidence, the population proportion of adults who support labeling
legislation for genetically modified organisms (GMOs). Her estimate must be accurate within 4% of the true proportion.
(a) No preliminary estimate is available. Find the minimum sample size needed.
(b) Find the minimum sample size needed, using a prior study that found that 65% of the respondents said they support
labeling legislation for GMOs.
(c) Compare the results from parts (a) and (b).
...
(a) What is the minimum sample size needed assuming that no prior information is available?
n =
(Round up to the nearest whole number as needed.)
The table available below shows the costs per mile (in cents) for a sample of automobiles. At a = 0.05, can you conclude that at least one mean
cost per mile is different from the others?
Click on the icon to view the data table.
Let Hss, HMS, HLS, Hsuv and Hмy represent the mean costs per mile for small sedans, medium sedans, large sedans, SUV 4WDs, and minivans
respectively. What are the hypotheses for this test?
OA. Ho: Not all the means are equal.
Ha Hss HMS HLS HSUV HMV
B. Ho Hss HMS HLS HSUV = μMV
Ha: Hss *HMS *HLS*HSUV * HMV
C. Ho Hss HMS HLS HSUV =μMV
= =
H: Not all the means are equal.
D. Ho Hss HMS
HLS HSUV HMV
Ha Hss HMS
HLS =HSUV = HMV
Chapter 13 Solutions
MyLab Statistics for Business Stats with Pearson eText -- Standalone Access Card -- for Statistics for Business and Economics
Ch. 13.4 - What is a control chart? Describe its use.Ch. 13.4 - Explain why rational subgrouping should be used in...Ch. 13.4 - When a control chart is first constructed, why are...Ch. 13.4 - Which process parameter is an x -chart used to...Ch. 13.4 - Even if all the points on an x -chart fall between...Ch. 13.4 - What must be true about the variation of a process...Ch. 13.4 - Use the six pattern-analysis rules described in...Ch. 13.4 - Consider the x -chart shown below. a. Is the...Ch. 13.4 - Use Table IX on page 13-74 to find the value of A2...Ch. 13.4 - Twenty-five consecutive samples of size n = 5 were...
Ch. 13.4 - The data in the following table were collected for...Ch. 13.4 - Prob. 13.12ACBCh. 13.4 - Active pharmaceutical ingredient. During the...Ch. 13.4 - Detecting gender-related employment disparities....Ch. 13.4 - Pain levels of ICU patients. Various interventions...Ch. 13.4 - Quality control for irrigation data. Most farmers...Ch. 13.4 - Improving public health waiting times. Statistical...Ch. 13.4 - Cereal box manufacturing. A machine at K-Company...Ch. 13.4 - Detecting under-reported emissions. The...Ch. 13.4 - 13 20 Selecting the best wafer-slicing machine....Ch. 13.4 - Chunky data. BPI Consulting, a leading provider of...Ch. 13.4 - Military aircraft bolts. A precision parts...Ch. 13.5 - What characteristic of a process is an R-chart...Ch. 13.5 - Prob. 13.24LMCh. 13.5 - Use Table IX on page 13-74 to find the values of...Ch. 13.5 - Construct and interpret an R-chart for the data in...Ch. 13.5 - Construct and interpret an R-chart for the data in...Ch. 13.5 - Construct and interpret an R-chart and an x -chart...Ch. 13.5 - Weight of packed frozen scallops. In Quality...Ch. 13.5 - Detecting gender-related employment disparities....Ch. 13.5 - Pain levels of ICU patients. Refer to the Research...Ch. 13.5 - Quality control for irrigation data. Refer to...Ch. 13.5 - Lowering the thickness of an expensive blow-molded...Ch. 13.5 - Cola bottle filling process. A soft-drink bottling...Ch. 13.5 - Chunky data. Refer to Exercise 13.21e (p. 13-40)...Ch. 13.5 - Replacement times for lost ATM cards. In an effort...Ch. 13.5 - Military aircraft bolts. Refer to the...Ch. 13.5 - Precision of scale weight measurements. The...Ch. 13.6 - What characteristic of a process is a p-chart...Ch. 13.6 - In each of the following cases, use the sample...Ch. 13.6 - The proportion of defective items generated by a...Ch. 13.6 - To construct a p-chart for a manufacturing...Ch. 13.6 - To construct a p-chart, 20 samples of size 150...Ch. 13.6 - Academic failure rates in Nigeria. The quality...Ch. 13.6 - Monitoring surgery complications. An article on...Ch. 13.6 - Rental car call center study. A worldwide rental...Ch. 13.6 - Defective micron chips. A manufacturer produces...Ch. 13.6 - Hand break cable defects. In Control Engineering...Ch. 13.6 - Monitoring newspaper typesetters. Accurate...Ch. 13.6 - Quality of rewritable CDs. A Japanese compact disc...Ch. 13.6 - Leaky process pumps. Quality (February 2008)...Ch. 13.6 - Rubber company lire tests. Goodstone Tire Rubber...Ch. 13.7 - Explain why it is inappropriate to conduct a...Ch. 13.7 - Explain the difference between process spread and...Ch. 13.7 - Describe two different ways to assess the...Ch. 13.7 - Why is it recommended to use and interpret Cp in...Ch. 13.7 - For a process that is in control and follows a...Ch. 13.7 - Find the specification spread for each of the...Ch. 13.7 - Find (or estimate) the process spread for each of...Ch. 13.7 - Find the value of Cp for each of the following...Ch. 13.7 - Upper specification limit of a process. An...Ch. 13.7 - Capability of an in-control process. A process is...Ch. 13.7 - Water use at a thermal power plant. Thermal power...Ch. 13.7 - Cereal box filling process. Refer to the data on...Ch. 13.7 - Military aircraft bolts. Refer to Exercise 13.22...Ch. 13.7 - Bioreactor production of antibodies. Benchtop...Ch. 13.7 - Driver gear bore holes. During the manufacture of...Ch. 13.7 - Lowering the thickness of an expensive blow-molded...Ch. 13 - Define quality and list its important dimensions.Ch. 13 - What is a process? Give an example of an...Ch. 13 - What is a system? Give an example of a system with...Ch. 13 - Describe the six major sources of process...Ch. 13 - Suppose all the output of a process over the last...Ch. 13 - Processes that are in control are predictable;...Ch. 13 - Compare and contrast special and common causes...Ch. 13 - Explain the difference between control limits and...Ch. 13 - Should control charts be used to monitor a process...Ch. 13 - Under what circumstances is it appropriate to use...Ch. 13 - A process is under control and follows a normal...Ch. 13 - Weight of a product. Consider the time series data...Ch. 13 - Lengths of pencils. The length measurements of 20...Ch. 13 - Applying pattern-analysis rules. Use the...Ch. 13 - Defective plastic mold. A company that...Ch. 13 - Robotics clamp gap width. Control chart...Ch. 13 - Package sorting time. AirExpress. an overnight...Ch. 13 - Waiting times of airline passengers. Officials at...Ch. 13 - Defects in graphite shafts. Over the last year, a...Ch. 13 - New iron-making process. Mining Engineering...Ch. 13 - CPU of a computer chip. The central processing...Ch. 13 - Bayfield Mud Company case. The text Quantitative...
Knowledge Booster


Learn more about
Need a deep-dive on the concept behind this application? Look no further. Learn more about this topic, statistics and related others by exploring similar questions and additional content below.Similar questions
- Question: A company launches two different marketing campaigns to promote the same product in two different regions. After one month, the company collects the sales data (in units sold) from both regions to compare the effectiveness of the campaigns. The company wants to determine whether there is a significant difference in the mean sales between the two regions. Perform a two sample T-test You can provide your answer by inserting a text box and the answer must include: Null hypothesis, Alternative hypothesis, Show answer (output table/summary table), and Conclusion based on the P value. (2 points = 0.5 x 4 Answers) Each of these is worth 0.5 points. However, showing the calculation is must. If calculation is missing, the whole answer won't get any credit.arrow_forwardBinomial Prob. Question: A new teaching method claims to improve student engagement. A survey reveals that 60% of students find this method engaging. If 15 students are randomly selected, what is the probability that: a) Exactly 9 students find the method engaging?b) At least 7 students find the method engaging? (2 points = 1 x 2 answers) Provide answers in the yellow cellsarrow_forwardIn a survey of 2273 adults, 739 say they believe in UFOS. Construct a 95% confidence interval for the population proportion of adults who believe in UFOs. A 95% confidence interval for the population proportion is ( ☐, ☐ ). (Round to three decimal places as needed.)arrow_forward
- Find the minimum sample size n needed to estimate μ for the given values of c, σ, and E. C=0.98, σ 6.7, and E = 2 Assume that a preliminary sample has at least 30 members. n = (Round up to the nearest whole number.)arrow_forwardIn a survey of 2193 adults in a recent year, 1233 say they have made a New Year's resolution. Construct 90% and 95% confidence intervals for the population proportion. Interpret the results and compare the widths of the confidence intervals. The 90% confidence interval for the population proportion p is (Round to three decimal places as needed.) J.D) .arrow_forwardLet p be the population proportion for the following condition. Find the point estimates for p and q. In a survey of 1143 adults from country A, 317 said that they were not confident that the food they eat in country A is safe. The point estimate for p, p, is (Round to three decimal places as needed.) ...arrow_forward
- (c) Because logistic regression predicts probabilities of outcomes, observations used to build a logistic regression model need not be independent. A. false: all observations must be independent B. true C. false: only observations with the same outcome need to be independent I ANSWERED: A. false: all observations must be independent. (This was marked wrong but I have no idea why. Isn't this a basic assumption of logistic regression)arrow_forwardBusiness discussarrow_forwardSpam filters are built on principles similar to those used in logistic regression. We fit a probability that each message is spam or not spam. We have several variables for each email. Here are a few: to_multiple=1 if there are multiple recipients, winner=1 if the word 'winner' appears in the subject line, format=1 if the email is poorly formatted, re_subj=1 if "re" appears in the subject line. A logistic model was fit to a dataset with the following output: Estimate SE Z Pr(>|Z|) (Intercept) -0.8161 0.086 -9.4895 0 to_multiple -2.5651 0.3052 -8.4047 0 winner 1.5801 0.3156 5.0067 0 format -0.1528 0.1136 -1.3451 0.1786 re_subj -2.8401 0.363 -7.824 0 (a) Write down the model using the coefficients from the model fit.log_odds(spam) = -0.8161 + -2.5651 + to_multiple + 1.5801 winner + -0.1528 format + -2.8401 re_subj(b) Suppose we have an observation where to_multiple=0, winner=1, format=0, and re_subj=0. What is the predicted probability that this message is spam?…arrow_forward
- Consider an event X comprised of three outcomes whose probabilities are 9/18, 1/18,and 6/18. Compute the probability of the complement of the event. Question content area bottom Part 1 A.1/2 B.2/18 C.16/18 D.16/3arrow_forwardJohn and Mike were offered mints. What is the probability that at least John or Mike would respond favorably? (Hint: Use the classical definition.) Question content area bottom Part 1 A.1/2 B.3/4 C.1/8 D.3/8arrow_forwardThe details of the clock sales at a supermarket for the past 6 weeks are shown in the table below. The time series appears to be relatively stable, without trend, seasonal, or cyclical effects. The simple moving average value of k is set at 2. What is the simple moving average root mean square error? Round to two decimal places. Week Units sold 1 88 2 44 3 54 4 65 5 72 6 85 Question content area bottom Part 1 A. 207.13 B. 20.12 C. 14.39 D. 0.21arrow_forward
arrow_back_ios
SEE MORE QUESTIONS
arrow_forward_ios
Recommended textbooks for you
 Big Ideas Math A Bridge To Success Algebra 1: Stu...AlgebraISBN:9781680331141Author:HOUGHTON MIFFLIN HARCOURTPublisher:Houghton Mifflin Harcourt
 Glencoe Algebra 1, Student Edition, 9780079039897...AlgebraISBN:9780079039897Author:CarterPublisher:McGraw Hill
 Linear Algebra: A Modern IntroductionAlgebraISBN:9781285463247Author:David PoolePublisher:Cengage Learning
 Holt Mcdougal Larson Pre-algebra: Student Edition...AlgebraISBN:9780547587776Author:HOLT MCDOUGALPublisher:HOLT MCDOUGAL
Big Ideas Math A Bridge To Success Algebra 1: Stu...
Algebra
ISBN:9781680331141
Author:HOUGHTON MIFFLIN HARCOURT
Publisher:Houghton Mifflin Harcourt
Glencoe Algebra 1, Student Edition, 9780079039897...
Algebra
ISBN:9780079039897
Author:Carter
Publisher:McGraw Hill
Linear Algebra: A Modern Introduction
Algebra
ISBN:9781285463247
Author:David Poole
Publisher:Cengage Learning
Holt Mcdougal Larson Pre-algebra: Student Edition...
Algebra
ISBN:9780547587776
Author:HOLT MCDOUGAL
Publisher:HOLT MCDOUGAL
Introduction to Statistical Quality Control (SQC); Author: FORSEdu;https://www.youtube.com/watch?v=c18FKHUDZv8;License: Standard YouTube License, CC-BY
[DAXX] Introduction to Statistical Quality Control; Author: The Academician;https://www.youtube.com/watch?v=ypZGDxjSM60;License: Standard Youtube License