Concept explainers
a.
To Identify: The company which appears to be the largest at the end of Year 3.
a.
Answer to Problem 13.4MAD
The company which appears to be the largest using the revenue at the end of Year 3 is Company AT.
Explanation of Solution
Company AT has more revenue of $163,786 which is more than the revenue of Company F of revenue $27,638. Hence, Company AT appears to be the largest using the revenue at the end of Year 3.
b.
To Identify: The company which appears to be growing faster across the three years.
b.
Explanation of Solution
Identify the company which appears to be growing faster across the three years.
| Company | Year 3 | Year 2 | Year 1 |
| AT | 123% (1) | 110% (2) | 100% |
| F | 221% (3) | 143% (4) | 100% |
Table (1)
Working Note:
Calculate the growth rate of Company AT for the two years.
Calculate the growth rate of Company F for the two years.
Hence, the company which appears to be growing faster across the three years is Company F.
c.
To Compute: The cash used to purchase property, plant, and equipment as a percent of the
c.
Explanation of Solution
Compute the cash used to purchase property, plant, and equipment as a percent of the cash flows from operating activities for all three years for each company.
| Company | Year 3 | Year 2 | Year 1 |
| AT | 56% (5) | 56% (6) | 68% (7) |
| F | 28% (8) | 24% (9) | 25% (10) |
Table (2)
Working Note:
Calculate the cash used to purchase property, plant, and equipment as a percent of the cash flows from operating activities of Company AT for three years.
For Year 3:
For Year 2:
For Year 1:
Calculate the cash used to purchase property, plant, and equipment as a percent of the cash flows from operating activities of Company F for three years.
For Year 3:
For Year 2:
For Year 1:
d.
To Identify: The company which appears to require more cash to purchase property, plant, and equipment and to explain its impact on
d.
Answer to Problem 13.4MAD
By using the computation in (C), it is clear that the company which appears to require more cash to purchase property, plant, and equipment is Company F, and its impact on free cash flow is more negative.
Explanation of Solution
The cash used to purchase property, plant, and equipment as a percent of the cash flows from operating activities of Company F for Year 1 is 25% which is much less than that of Company F of 68%. But for Year 2, and Year 3, the cash used to purchase property, plant, and equipment as a percent of the cash flows from operating activities of Company AT are 56%, and 56%, which are greater than those of Company F of 24%, and 28%.
Hence, as the cash used to purchase property, plant, and equipment as a percent of the cash flows from operating activities of Company F from Year 1 to Year 3 is increasing, the company which appears to require more cash to purchase property, plant, and equipment is Company F and its net impact on free cash flow is more negative.
e.
To Compute: The ratio of free cash flow to revenue for all three years for each company.
e.
Explanation of Solution
Compute the free cash flow of Company AT.
| Year 3 | Year 2 | Year 1 | |
| Cash flows from operating activities | $ 39,344 | $35,880 | $ 31,338 |
Cash used to purchase property, plant, and equipment |
(22,408) |
(20,015) |
(21,433) |
| Free cash flow | $ 16,936 | $15,865 | $ 9,905 |
Table (3)
Compute the ratio of free cash flow to revenue for Company AT.
| Year 3 | Year 2 | Year 1 | |
| Free cash flow (A) | $ 16,936 | $15,865 | $ 9,905 |
| Revenue (B) | 163,786 | 146,801 | 132,447 |
| Ratio of free cash flow to revenues
|
10.3% | 10.8% | 7.5% |
Table (4)
Compute the free cash flow of Company F.
| Year 3 | Year 2 | Year 1 | |
| Cash flows from operating activities | $16,108 | $10,320 | $7,326 |
Cash used to purchase property, plant, and equipment |
(4,491) |
(2,523) |
(1,831) |
| Free cash flow | $ 11,617 | $7,797 | $ 5,495 |
Table (5)
Compute the ratio of free cash flow to revenue for Company F.
| Year 3 | Year 2 | Year 1 | |
| Free cash flow (A) | $ 11,617 | $7,797 | $ 5,495 |
| Revenue (B) | 27,638 | 17,928 | 12,466 |
| Ratio of free cash flow to revenues
|
42% | 43.4% | 44% |
Table (6)
Hence, the ratio of free cash flow to revenue for Year 3, Year 2, and Year 1 for Company AT are 10.3%, 10.8%, and 7.5% respectively. And for Company F, they are 42%, 43.4%, and 44% respectively.
F.
To plot: The data on a line chart with the years on the horizontal axis.
F.
Explanation of Solution
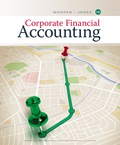
Plot the data on a line chart with the years on the horizontal axis.
Figure (1)
The ratio of free cash flow to revenue of Company AT for Year 1 was better when compared to Company F. But in the Year 2, and Year 3, the ratios of free cash flow to revenue of Company F were much greater than Company AT. The cash flows from operating activities of Company F have significantly increased over the years. Due to this, there is an increase in the ratio of free cash flows to revenues. The decline in the ratio of free cash flows to revenues of Company AT is due to the decline in the cash flows from operating activities, and increase in the cash needed to purchase property, plant, and equipment over the three years. The net result of this is that the ratio is declined.
Want to see more full solutions like this?
Chapter 13 Solutions
Corporate Financial Accounting


- I am looking for the correct answer to this general accounting problem using valid accounting standards.arrow_forwardPlease help me solve this general accounting problem with the correct financial process.arrow_forwardPlease provide the answer to this general accounting question using the right approach.arrow_forward
- I need help with this general accounting question using standard accounting techniques.arrow_forwardmanagerial accounting questionarrow_forwardA firm is considering making a change to its capital structure to reduce its cost of capital and increase firm value. Right now, it has a capital structure that consists of 20% debt and 80% equity, based on market value. The risk-free rate is 6% and the market risk premium is 5%. Currently the company's costs of equity, which is based on the CAP<, is 12.5% and its tax rate is 40%. What would be Carwright's estimated cost of equity if it were to change its capital structure to 60% debt and 40% equity?arrow_forward
- A company has the following data, in thousands. Assuming a 365-day year, what is the firm's cash conversion cycle? Annual Sales = $45,000 Annual cost of goods sold = $31,500 Inventories = $4,250 Accounts receivable = $2,000 Accounts payable = $3,400arrow_forwardaccounting questionarrow_forwardsubject = general accountingarrow_forward
 Business/Professional Ethics Directors/Executives...AccountingISBN:9781337485913Author:BROOKSPublisher:Cengage
 Accounting Information SystemsAccountingISBN:9781337619202Author:Hall, James A.Publisher:Cengage Learning,
 Managerial Accounting: The Cornerstone of Busines...AccountingISBN:9781337115773Author:Maryanne M. Mowen, Don R. Hansen, Dan L. HeitgerPublisher:Cengage Learning
 Pkg Acc Infor Systems MS VISIO CDFinanceISBN:9781133935940Author:Ulric J. GelinasPublisher:CENGAGE L
 Financial AccountingAccountingISBN:9781337272124Author:Carl Warren, James M. Reeve, Jonathan DuchacPublisher:Cengage Learning