
To find: The conditional
Answer to Problem 13.47E
The conditional probability that he or she also smokes cigarettes given that a student smoke electronic cigarette is 0.1875.
The conditional probability that he or she also smokes electronic cigarettes given that a student smoke cigarette is 0.3333.
Explanation of Solution
Given info:
The youth of U.S. has declined cigarette smoking in recent years while the use of some other tobacco products has increased. The high school students used several tobacco products in last 30 days, more than who had used more than half and multiple tobacco products. Let A, B and C denotes the
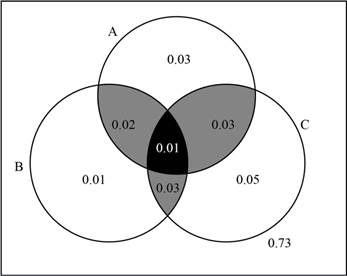
Events A denotes cigarette, B denotes electronic cigarette and C denotes other tobacco products including cigars, pipes, smokeless tobacco and hookahs.
The probabilities that a randomly selected high school student used these different tobacco products are shown below:
Calculation:
From the given information,
The remaining probabilities are given below:
The probability of
The probability of
The probability of
The probability of
The probability of
The probability of
Venn diagram:
The Venn diagram of the events A, B and C and mark the probabilities of all combinations of school students used different tobacco product is given below:
Probability:
The conditional probability that he or she also smokes cigarettes given that a student smoke electronic cigarette and the conditional probability that he or she also smokes electronic cigarettes given that a student smoke cigarette are obtained as shown below:
The conditional probability that he or she also smokes cigarettes given that a student smoke electronic cigarette is given as,
Thus, the conditional probability that a student smokes cigarettes given that he or she smokes electronic cigarette is 0.1875.
The conditional probability that a student smokes electronic cigarettes given that he or she smokes cigarette is given as,
Thus, the conditional probability that a student smokes electronic cigarette given that he or she smokes cigarette is 0.3333.
Interpretation:
Among the different types of tobacco products used by the high school students, the percentage of students who smoke cigarette given that electronic cigarette is 18.75% and the percentage of students who smoke electronic cigarette given that smoke cigarette is 33.33%.
Want to see more full solutions like this?
Chapter 13 Solutions
BASIC PRACTICE OF STATISTICS(REISSUE)>C

- appropriate probabilities. 19 Using the data from Table 17-1, are gender and political party independent for this group? nis cow sib signia si Falows grillor le pussarrow_forward11 Using the same toddler data, describe the toddlers with marginal probabilities only. BAY bit of benoliesmas (89 abje' jook stages of te cojota ing ou an out of to cojota ovig ber el ba 3+4=029arrow_forward21 Using the data from the table in Question 1, does the dominant hand differ for male toddlers versus female toddlers? (In other words, are these two events dependent?)arrow_forward
- op In a two-way table with variables A and B, does P(A|B) + P(A|B) = 1? பே 69 6 work as m 3 atavs ow to portabagabat sot gaisarrow_forwardIn a two-way table with variables A and B, does P(A|B)+P(A|B)=1? dsins/Ispino936) 1 durab ALED a to gilidadost Earrow_forwardpreference are dependent (you even have to look at the males). Using the bumper sticker data in the first example problem in this chapter, are car age and number of bumper stickers related (In other words, are these two events dependent?) d insbusqabni oss agit ads bms gliw woy tadi validadong ada 15W wex s m ad ow MP gliw Boy 1st yilidadong at al terW .d Shsed smo viaxe 5X9 of pe 012 from 12 or to HOM qose Aunt swam to prepants M&arrow_forward
- 23 வ dous biops Which marginal probabilities that you find in a two-way table should sum to 1? 著arrow_forwardUsing the toddler data from the table in Question 1 and appropriate probability notation, do the following: a. Compare the right-handed female and male toddlers in the sample, using condi- tional probabilities (only). b. Compare the right-handed toddlers asid in the sample, using conditional probabilities (only).dependent abni sis & bas bax bensqged snavs med) galworl andarrow_forwardUsing the toddler data from the table in Question 1 and appropriate probability notation, identify and calculate the following: a. What percentage of the male toddlers are right-handed? te b. What percentage of the female toddlers are right-handed? c. What percentage of the right-handed toddlers are male? d. What percentage of the right-handed toddlers are female?arrow_forward
- 10 Using the toddler data from the table in Question 1 and the appropriate probability Tonotation, identify and calculate ther s following: a. What percentage of the toddlers are right-handed? b. now to What percentage of the toddlers are female? female? da boit vom wo c. What proportion of the toddlers are left-handed? d. What's the chance of finding a male toddler from the sample? [10arrow_forward9 Using the car data from the bumper sticker table earlier in this chapter and the appro- priate probability notation, identify and calculate the following: a. What percentage of the cars are newer cars? b. What's the proportion of older cars? c. What percentage of the cars have a lot of bumper stickers? d. What's the probability that a car doesn't have a lot of bumper stickers?arrow_forwardSuppose that you roll a single die two times, and the trials are independent. What is the chance of rolling two 1s?arrow_forward
 MATLAB: An Introduction with ApplicationsStatisticsISBN:9781119256830Author:Amos GilatPublisher:John Wiley & Sons Inc
 Probability and Statistics for Engineering and th...StatisticsISBN:9781305251809Author:Jay L. DevorePublisher:Cengage Learning
 Statistics for The Behavioral Sciences (MindTap C...StatisticsISBN:9781305504912Author:Frederick J Gravetter, Larry B. WallnauPublisher:Cengage Learning
 Elementary Statistics: Picturing the World (7th E...StatisticsISBN:9780134683416Author:Ron Larson, Betsy FarberPublisher:PEARSON
 The Basic Practice of StatisticsStatisticsISBN:9781319042578Author:David S. Moore, William I. Notz, Michael A. FlignerPublisher:W. H. Freeman
 Introduction to the Practice of StatisticsStatisticsISBN:9781319013387Author:David S. Moore, George P. McCabe, Bruce A. CraigPublisher:W. H. Freeman