Concept explainers
Videos
A.
Statement of
Statement of cash flow is a financial statement that shows the cash and cash equivalents of a company for a particular period of time. It shows the net changes in cash, by reporting the sources and uses of cash as a result of operating, investing, and financing activities of a company.
Free cash flow describes the net cash provided from operating activities after making required adjustments for dividends and capital expenditures. In other words, it is the cash flow arrived after making payment for capital expenditures and dividend payments.
To Identify: The company which appears to be the largest at the end of Year 3.
A.
Answer to Problem 13.3ADM
The company which appears to be the largest using the revenue at the end of Year 3 is Company AT.
Explanation of Solution
Company AT has more revenue of $132,447 which is more than the revenue of Company F of revenue $12,466. Hence, Company AT appears to be the largest using the revenue at the end of Year 3.
B.
To Identify: The company which appears to be growing faster across the three years.
B.
Answer to Problem 13.3ADM
Identify the company which appears to be growing faster across the three years.
| Company | Year 3 | Year 2 | Year 1 |
| AT | 104% (1) | 101% (2) | 100% |
| F | 245% (3) | 155% (4) | 100% |
Table (1)
Explanation of Solution
Working Note:
Calculate the growth rate of Company AT for the two years.
Calculate the growth rate of Company F for the two years.
Hence, the company which appears to be growing faster across the three years is Company F.
C.
To Compute: The cash used to purchase property, plant, and equipment as a percent of the cash flows from operating activities for all three years for each company.
C.
Answer to Problem 13.3ADM
Compute the cash used to purchase property, plant, and equipment as a percent of the cash flows from operating activities for all three years for each company.
| Company | Year 3 | Year 2 | Year 1 |
| AT | 68% (5) | 61% (6) | 50% (7) |
| F | 34% (8) | 32% (9) | 77% (10) |
Table (2)
Explanation of Solution
Working Note:
Calculate the cash used to purchase property, plant, and equipment as a percent of the cash flows from operating activities of Company AT for three years.
For Year 3:
For Year 2:
For Year 1:
Calculate the cash used to purchase property, plant, and equipment as a percent of the cash flows from operating activities of Company F for three years.
For Year 3:
For Year 2:
For Year 1:
Hence, the company which appears to be growing faster across the three years is Company F.
D.
To Identify: The company which appears to require more cash to purchase property, plant, and equipment and to explain its impact on free cash flow.
D.
Answer to Problem 13.3ADM
By using the computation in (C), it is clear that the company which appears to require more cash to purchase property, plant, and equipment is Company AT, and its impact on free cash flow is more negative.
Explanation of Solution
The cash used to purchase property, plant, and equipment as a percent of the cash flows from operating activities of Company AT for Year 1 is 50% which is much less than that of Company F of 77%. But for Year 2, and Year 3, the cash used to purchase property, plant, and equipment as a percent of the cash flows from operating activities of Company AT are 61%, and 68%, which are greater than those of Company F of 32%, and 34%.
Hence, as the cash used to purchase property, plant, and equipment as a percent of the cash flows from operating activities of Company AT from Year 1 to Year 3 is increasing, the company which appears to require more cash to purchase property, plant, and equipment is Company AT, and its net impact on free cash flow is more negative.
E.
To Compute: The ratio of free cash flow to revenue for all three years for each company.
E.
Explanation of Solution
Compute the free cash flow of Company AT.
| Year 3 | Year 2 | Year 1 | |
| Cash flows from operating activities | $ 31,338 | $34,796 | $ 39,176 |
Cash used to purchase property, plant, and equipment |
(21,433) |
(21,228) |
(19,728) |
| Free cash flow | $ 9,905 | $13,568 | $ 19,448 |
Table (3)
Compute the ratio of free cash flow to revenue for Company AT.
| Year 3 | Year 2 | Year 1 | |
| Free cash flow (A) | $ 9,905 | $13,568 | $ 19,448 |
| Revenue (B) | 132,447 | 128,752 | 127,434 |
| Ratio of free cash flow to revenues
|
7.5% | 10.5% | 15.3% |
Table (4)
Compute the free cash flow of Company F.
| Year 3 | Year 2 | Year 1 | |
| Cash flows from operating activities | $ 5,457 | $4,222 | $1,612 |
Cash used to purchase property, plant, and equipment |
(1,831) |
(1,362) |
(1,235) |
| Free cash flow | $ 3,626 | $2,860 | $ 377 |
Table (5)
Compute the ratio of free cash flow to revenue for Company F.
| Year 3 | Year 2 | Year 1 | |
| Free cash flow (A) | $ 3,626 | $2,860 | $ 377 |
| Revenue (B) | 12,466 | 7,872 | 5,089 |
| Ratio of free cash flow to revenues
|
29.1% | 36.3% | 7.4% |
Table (6)
Hence, the ratio of free cash flow to revenue for Year 3, Year 2, and Year 1 for Company AT are 7.5%, 10.5%, and 15.3% respectively. And for Company F, they are 29.1%, 36.3%, and 7.4% respectively.
To plot: The data on a line chart with the years on the horizontal axis.
Explanation of Solution
Plot the data on a line chart with the years on the horizontal axis.
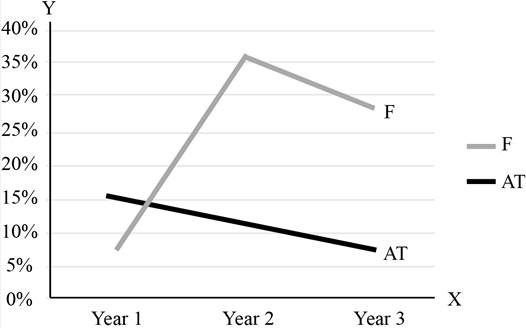
Figure (1)
F.
To Interpret: The chart.
F.
Explanation of Solution
The ratio of free cash flow to revenue of Company AT for Year 1 was better when compared to Company F. But in the Year 2, and Year 3, the ratios of free cash flow to revenue of Company F were much greater than Company AT. The cash flows from operating activities of Company F have significantly increased over the years. Due to this, there is an increase in the ratio of free cash flows to revenues. The decline in the ratio of free cash flows to revenues of Company AT is due to the decline in the cash flows from operating activities, and increase in the cash needed to purchase property, plant, and equipment over the three years. The net result of this is that the ratio is declined.
Want to see more full solutions like this?
Chapter 13 Solutions
Bundle: Corporate Financial Accounting, Loose-leaf Version, 14th + CengageNOWv2, 1 term Printed Access Card


- I am looking for a step-by-step explanation of this financial accounting problem with correct standards.arrow_forwardI need help solving this general accounting question with the proper methodology.arrow_forwardReba Dixon is a fifth-grade school teacher who earned a salary of $37,080 in 2024. She is 45 years old and receives $1,200 of alimony payments each month from her former husband (divorced in 2016). Reba also rents out a small apartment building. This year Reba received $54,600 of rental payments from tenants, and she incurred $19,500 of expenses associated with the rental. Reba and her daughter Heather (20 years old at the end of the year) moved to Georgia in January of this year. Reba provides more than one-half of Heather's support. They had been living in Colorado for the past 15 years, but ever since her divorce, Reba has been wanting to move back to Georgia to be closer to her family. Luckily, last December, a teaching position opened up and Reba and Heather decided to make the move. Reba paid a moving company $2,470 to move their personal belongings, and she and Heather spent two days driving the 1,820 miles to Georgia. Reba rented a home in Georgia. Heather decided to continue…arrow_forward
- Boston Industries completes job #842, which has a standard of 840 labor hours at a standard rate of $22.75 per hour. The job was completed in 890 hours, and the average actual labor rate was $23.10 per hour. What is the labor efficiency (quantity) variance? (A negative number indicates a favorable variance and a positive number indicates an unfavorable variance.)arrow_forwardPlease explain the solution to this general accounting problem with accurate principles.arrow_forwardI am looking for the correct answer to this general accounting question with appropriate explanations.arrow_forward
- Month Monthly Product Demand 2021-01-01 207.55 2021-02-01 208.25 2021-03-01 209.33 2021-04-01 210.11 2021-05-01 213.78 2021-06-01 225.12 2021-07-01 227.19 2021-08-01 218.92 2021-09-01 213.25 2021-10-01 210.75 2021-11-01 215.97 2021-12-01 223.97 2022-01-01 220.54 2022-02-01 213.47 2022-03-01 218.48 2022-04-01 222.07 2022-05-01 222.85 2022-06-01 236.38 2022-07-01 248.60 2022-08-01 234.45 2022-09-01 217.32 2022-10-01 222.56 2022-11-01 237.77 2022-12-01 245.59 2023-01-01 237.75 2023-02-01 213.70 2023-03-01 238.18 2023-04-01 244.78 2023-05-01 233.42 2023-06-01 241.35 2023-07-01 267.98 2023-08-01 249.97 2023-09-01 220.58 2023-10-01 233.12 2023-11-01 240.90 2023-12-01 268.61 2024-01-01 250.80 2024-02-01 225.31 2024-03-01 247.32 2024-04-01 248.50 2024-05-01 237.35 2024-06-01 258.62 2024-07-01 284.45 2024-08-01 256.21 2024-09-01 225.73 2024-10-01 234.07 2024-11-01 263.70 2024-12-01 286.03 Please…arrow_forwardAccounting 12 May I please have a brief summary highlighting one unique feature of the app, recommending it to Sadie—who wants to use some apps for her dog grooming salon to schedule grooming appointments? Thank you so much,arrow_forwardGiven solution for General accounting question not use aiarrow_forward
- Kindly help me with this General accounting questions not use chart gpt please fast given solutionarrow_forwardPlease given correct answer for General accounting question I need step by step explanationarrow_forwardQuiksilver Company sold 4,480 units in October at a price of $63 per unit. The variable cost is $51 per unit. Calculate the total contribution margin. A. $62,060 B. $73,080 C. $56,000 D. $99,750 E. $ 53,760 helparrow_forward
 Managerial AccountingAccountingISBN:9781337912020Author:Carl Warren, Ph.d. Cma William B. TaylerPublisher:South-Western College Pub
 Financial And Managerial AccountingAccountingISBN:9781337902663Author:WARREN, Carl S.Publisher:Cengage Learning,
 Century 21 Accounting Multicolumn JournalAccountingISBN:9781337679503Author:GilbertsonPublisher:Cengage
- Principles of Accounting Volume 1AccountingISBN:9781947172685Author:OpenStaxPublisher:OpenStax College