Videos
To create:
The
Answer to Problem 13.2P
Solution:
The script file is,
matrix = zeros(2, 2, 3);
%define the 3*3 true color matrix.
matrix(1, 1, 3) = 255;
matrix(1, 3, 3) = 255;
matrix(1, 2, 3) = 255;
matrix(2, 1, 3) = 255;
matrix(3, 3, 3) = 255;
matrix(2, 2, 3) = 255;
matrix(2, 2, 3) = 255;
matrix(3, 1, 3) = 255;
matrix(3, 2, 3) = 255;
matrix(2, 3, 1) = 255;
matrix = uint8(matrix);
image(matrix);
%create an image of a 3*3 true color matrix.
Explanation of Solution
A true color matrix is created of the order of
MATLAB Code:
matrix = zeros(2, 2, 3);
%define the 3*3 true color matrix.
matrix(1, 1, 3) = 255;
matrix(1, 3, 3) = 255;
matrix(1, 2, 3) = 255;
matrix(2, 1, 3) = 255;
matrix(3, 3, 3) = 255;
matrix(2, 2, 3) = 255;
matrix(2, 2, 3) = 255;
matrix(3, 1, 3) = 255;
matrix(3, 2, 3) = 255;
matrix(2, 3, 1) = 255;
matrix = uint8(matrix);
image(matrix);
%create an image of a 3*3 true color matrix.
Save the MATLAB files with name, chapter13_54793_13_2P.m in the current folder. Execute the file by typing the name at the command window to generate output.
Result:
The figure window is,
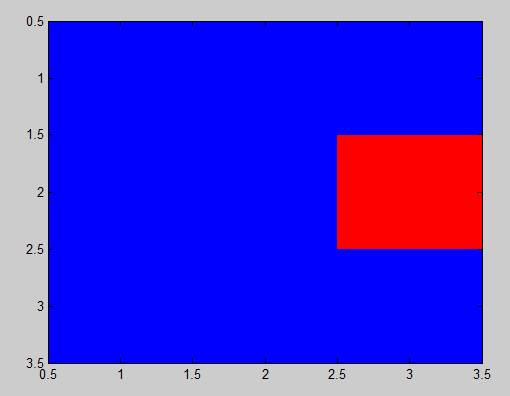
Therefore, the result is stated above.
Want to see more full solutions like this?
Chapter 13 Solutions
MATLAB: A Practical Introduction to Programming and Problem Solving


- Business Discussarrow_forwardThe following data represent total ventilation measured in liters of air per minute per square meter of body area for two independent (and randomly chosen) samples. Analyze these data using the appropriate non-parametric hypothesis testarrow_forwardeach column represents before & after measurements on the same individual. Analyze with the appropriate non-parametric hypothesis test for a paired design.arrow_forward
- Should you be confident in applying your regression equation to estimate the heart rate of a python at 35°C? Why or why not?arrow_forwardGiven your fitted regression line, what would be the residual for snake #5 (10 C)?arrow_forwardCalculate the 95% confidence interval around your estimate of r using Fisher’s z-transformation. In your final answer, make sure to back-transform to the original units.arrow_forward
 College Algebra (MindTap Course List)AlgebraISBN:9781305652231Author:R. David Gustafson, Jeff HughesPublisher:Cengage Learning

 Algebra & Trigonometry with Analytic GeometryAlgebraISBN:9781133382119Author:SwokowskiPublisher:Cengage
 Algebra and Trigonometry (MindTap Course List)AlgebraISBN:9781305071742Author:James Stewart, Lothar Redlin, Saleem WatsonPublisher:Cengage Learning
 Elementary Linear Algebra (MindTap Course List)AlgebraISBN:9781305658004Author:Ron LarsonPublisher:Cengage Learning