
EBK MACROECONOMICS
4th Edition
ISBN: 8220103648165
Author: KRUGMAN
Publisher: MAC HIGHER
expand_more
expand_more
format_list_bulleted
Question
Chapter 13, Problem 11P
To determine
Concept Introduction:
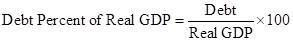
Formula to calculate debt percent of real GDP,
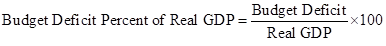
Formula to calculate budget deficit percent of real GDP,
Expert Solution & Answer
Answer to Problem 11P
a. Government budget deficit remains constant.
| Year | Real GDP(billions $)  | Debt(billions $)  | Budget Deficit(billions $)  | Debt % of Real GDP(%)  | Budget Deficit% of Real GDP(%)  |
| 2016 | 1,000 | 300 | 30 | 30 | 3 |
| 2017 | 1,030 | 309 | 30 | 30 | 2.91 |
| 2018 | 1,061 | 318.3 | 30 | 30 | 2.82 |
| 2019 | 1,093 | 328 | 30 | 30 | 2.74 |
| 2020 | 1,126 | 337 | 30 | 30 | 2.66 |
| 2021 | 1,159 | 347.7 | 30 | 30 | 2.58 |
| `2022 | 1,194 | 358.2 | 30 | 30 | 2.51 |
| 2023 | 1,230 | 369 | 30 | 30 | 2.43 |
| 2024 | 1,267 | 380 | 30 | 30 | 2.36 |
| 2025 | 1,305 | 391.5 | 30 | 30 | 2.29 |
| 2026 | 1,344 | 403.2 | 30 | 30 | 2.23 |
b. Government budget deficit grows by 3%.
| Year | Real GDP(billions $)  | Debt(billions $)  | Budget Deficit(billions $)  | Debt % of Real GDP(%)  | Budget Deficit% of Real GDP(%)  |
| 2016 | 1,000 | 300 | 30 | 30 | 3 |
| 2017 | 1,030 | 309 | 30.9 | 30 | 3 |
| 2018 | 1,061 | 318.3 | 31.8 | 30 | 2.99 |
| 2019 | 1,093 | 328 | 32.7 | 30 | 2.99 |
| 2020 | 1,126 | 337 | 33.6 | 30 | 2.98 |
| 2021 | 1,159 | 347.7 | 34.6 | 30 | 2.98 |
| `2022 | 1,194 | 358.2 | 35.6 | 30 | 2.98 |
| 2023 | 1,230 | 369 | 36.6 | 30 | 2.97 |
| 2024 | 1,267 | 380 | 37.6 | 30 | 2.96 |
| 2025 | 1,305 | 391.5 | 38.7 | 30 | 2.96 |
| 2026 | 1,344 | 403.2 | 39.8 | 30 | 2.96 |
c. Government budget deficit grows by 20%.
| Year | Real GDP(billions $)  | Debt(billions $)  | Budget Deficit(billions $)  | Debt % of Real GDP(%)  | Budget Deficit% of Real GDP(%)  |
| 2014 | 1,000 | 300 | 30 | 30 | 3 |
| 2015 | 1,030 | 309 | 36 | 30 | 3.49 |
| 2016 | 1,061 | 318.3 | 43.2 | 30 | 4.07 |
| 2017 | 1,093 | 328 | 51.8 | 30 | 4.73 |
| 2018 | 1,126 | 337 | 62.2 | 30 | 5.52 |
| 2019 | 1,159 | 347.7 | 74.6 | 30 | 6.43 |
| 2020 | 1,194 | 358.2 | 89.6 | 30 | 7.50 |
| 2021 | 1,230 | 369 | 107.5 | 30 | 8.73 |
| 2022 | 1,267 | 380 | 128.9 | 30 | 10.17 |
| 2023 | 1,305 | 391.5 | 154.7 | 30 | 11.85 |
| 2024 | 1,344 | 403.2 | 185.7 | 30 | 13.81 |
d. Debt-GDP ratio.
Debt-GDP ratio remains same in every case.
Explanation of Solution
- In part a, the budget deficit is constant so the debt-GDP ratio is 0.3 and deficit to GDP ratio is 0.03.
- In part b, the budget deficit increases by 3% so the debt-GDP ratio is 0.3 and in part c. the budget deficit increases by 20% so the debt-GDP ratio is 0.3.
Want to see more full solutions like this?
Subscribe now to access step-by-step solutions to millions of textbook problems written by subject matter experts!
Students have asked these similar questions
how to caculate marginal?
how to solve the attachments?
what is change in TC / change in Q? and what would be an example?
Knowledge Booster

Similar questions
- how to solve the attachment?arrow_forwardProblem 3-ABC Challenges: Attrition, Balance and ComplianceCan television inform people about public affairs? Political scientists Bethany Albertson and Adria Lawrence (2009) conducted an experiment in which they randomly assigned people to treatment and control groups to evaluate the effect of watching TV on a person’s information level. Those assigned to the treatment group were told to watch a specific television broadcast and were later asked questions related to what they watched. Those in the controlgroup were not shown the TV broadcast but were asked questions related to the material in the TV broadcast. The dataset contains the following variables: : Dummy variable which =1 if a person reads news and 0 otherwise. : interest in political affairs (not interested=1 to very interested=4) : years of education : female dummy variable (female=1; male=0) : family income in thousands of dollars : information level (low information level=1 to high information level=4) =1 if the…arrow_forwardProblem 2-Experiments/Randomized Control Trial Suppose you are interested in studying the effect of academic counselling on the years it takes for a student to obtain an undergraduate degree. You conduct a randomized control trial to answer the question. You randomly assign 2500 individuals in a university in New York to receive academic counselling and 2500 students to not receive any academic counselling. a. Which people are a part of the treatment group and which people are a part of thecontrol group? b. What regression will you run? Define the variables where required. c. Suppose you estimate = -0.3. Interpret it. d. You test for balance using the variables mentioned in the table below. Based on the results do you think that the treatment and control group are balanced? If your answer is “yes” then explain why. If your answer is “no”, then explain why and mention how will you address the issue of imbalance. e. Suppose that some unmotivated students in the control group decided to…arrow_forward
- How to calculate total cost?arrow_forwardProblem 1-Experiments/Randomized Control TrialSuppose you are interested in studying the effect of being a part of the labor union on anindividual’s hourly wage.You collect data on 1000 people and run the following regression. where is a dummy variable which is equal t to 1 for people who are a part of labor union and0 for others. a. Suppose you estimate . Interpret b. Do you think is biased or unbiased? Explain. Now suppose you conduct a randomized control trial to answer the same question. Yourandomly assign some individuals to be a part of the labor union and others to not be a partof the labor union. The first step you take is to ensure that the randomization was donecorrectly. Then you estimate the following equation: =1 if the student is assigned to be a part of Labor Union=0 if the student is assigned to not be a part of Labor Union c. Why is it important to ensure that the randomization is done correctly? d. Name any two variables that you can use to test if Treatment and…arrow_forwardWhat is kiosk?arrow_forward
- If food is produced in the U.S., sold in the U.S. and consumed in the U.S., a reduction in its price will have which of the following effects ______? Two of the answers are correct. The consumer price index will decrease. None of the answers are correct. The GDP deflator will decrease.arrow_forwardhow to caculate verible cost?arrow_forwardWhat is the deficit?arrow_forward
- Identify the two curves shown on the graph, and explain their upward and downward slopes. Why does curve Aintersect the horizontal axis? What is the significance of quantity d? What does erepresent? How would the optimal quantity of information change if the marginal benefit of information increased—that is, if the marginal benefit curve shifted upward?arrow_forward6. Rent seeking The following graph shows the demand, marginal revenue, and marginal cost curves for a single-price monopolist that produces a drug that helps relieve arthritis pain. Place the grey point (star symbol) in the appropriate location on the graph to indicate the monopoly outcome such that the dashed lines reveal the profit-maximizing price and quantity of a single-price monopolist. Then, use the green rectangle (triangle symbols) to show the profits earned by the monopolist. 18 200 20 16 16 14 PRICE (Dollars per dose) 12 10 10 8 4 2 MC = ATC MR Demand 0 0 5 10 15 20 25 30 35 40 45 50 QUANTITY (Millions of doses per year) Monopoly Outcome Monopoly Profits Suppose that should the patent on this particular drug expire, the market would become perfectly competitive, with new firms immediately entering the market with essentially identical products. Further suppose that in this case the original firm will hire lobbyists and make donations to several key politicians to extend its…arrow_forwardConsider a call option on a stock that does not pay dividends. The stock price is $100 per share, and the risk-free interest rate is 10%. The call strike is $100 (at the money). The stock moves randomly with u=2 and d=0.5. 1. Write the system of equations to replicate the option using A shares and B bonds. 2. Solve the system of equations and determine the number of shares and the number of bonds needed to replicate the option. Show your answer with 4 decimal places (x.xxxx); do not round intermediate calculations. This is easy to do in Excel. A = B = 3. Use A shares and B bonds from the prior question to calculate the premium on the option. Again, do not round intermediate calculations and show your answer with 4 decimal places. Call premium =arrow_forward
arrow_back_ios
SEE MORE QUESTIONS
arrow_forward_ios
Recommended textbooks for you

 Principles of Economics (12th Edition)EconomicsISBN:9780134078779Author:Karl E. Case, Ray C. Fair, Sharon E. OsterPublisher:PEARSON
 Engineering Economy (17th Edition)EconomicsISBN:9780134870069Author:William G. Sullivan, Elin M. Wicks, C. Patrick KoellingPublisher:PEARSON
 Principles of Economics (MindTap Course List)EconomicsISBN:9781305585126Author:N. Gregory MankiwPublisher:Cengage Learning
 Managerial Economics: A Problem Solving ApproachEconomicsISBN:9781337106665Author:Luke M. Froeb, Brian T. McCann, Michael R. Ward, Mike ShorPublisher:Cengage Learning
 Managerial Economics & Business Strategy (Mcgraw-...EconomicsISBN:9781259290619Author:Michael Baye, Jeff PrincePublisher:McGraw-Hill Education
Principles of Economics (12th Edition)
Economics
ISBN:9780134078779
Author:Karl E. Case, Ray C. Fair, Sharon E. Oster
Publisher:PEARSON
Engineering Economy (17th Edition)
Economics
ISBN:9780134870069
Author:William G. Sullivan, Elin M. Wicks, C. Patrick Koelling
Publisher:PEARSON
Principles of Economics (MindTap Course List)
Economics
ISBN:9781305585126
Author:N. Gregory Mankiw
Publisher:Cengage Learning
Managerial Economics: A Problem Solving Approach
Economics
ISBN:9781337106665
Author:Luke M. Froeb, Brian T. McCann, Michael R. Ward, Mike Shor
Publisher:Cengage Learning
Managerial Economics & Business Strategy (Mcgraw-...
Economics
ISBN:9781259290619
Author:Michael Baye, Jeff Prince
Publisher:McGraw-Hill Education