
Concept explainers
Videos
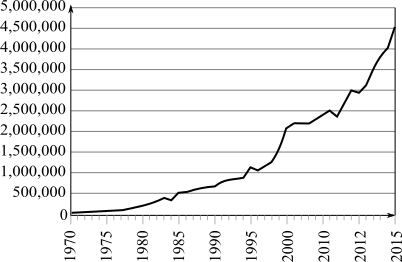
(a)
To calculate: The linear model for the cost (in thousands of dollars) of a super bowl ad y as a function of the number of years t since
| Year | |||||
| Cost |
The graph is;
(b)
To calculate: The linear model for the cost (in thousands of dollars) of a super bowl ad y as a function of the number of years t since
| Year | |||||
| Cost |
(c)
To calculate: The piecewise linear model for the cost of a Super Bowl ad during
(d)
To calculate: The cost of Super Bowl ad in
Want to see the full answer?
Check out a sample textbook solution
Chapter 1 Solutions
Finite Mathematics


- 10) Find n(K) given that n(T) = 7,n(KT) = 5,n(KUT) = 13.arrow_forward7) Use the Venn Diagram below to determine the sets A, B, and U. A = B = U = Blue Orange white Yellow Black Pink Purple green Grey brown Uarrow_forward8. For x>_1, the continuous function g is decreasing and positive. A portion of the graph of g is shown above. For n>_1, the nth term of the series summation from n=1 to infinity a_n is defined by a_n=g(n). If intergral 1 to infinity g(x)dx converges to 8, which of the following could be true? A) summation n=1 to infinity a_n = 6. B) summation n=1 to infinity a_n =8. C) summation n=1 to infinity a_n = 10. D) summation n=1 to infinity a_n diverges.arrow_forward
- 1) Use the roster method to list the elements of the set consisting of: a) All positive multiples of 3 that are less than 20. b) Nothing (An empty set).arrow_forward2) Let M = {all postive integers), N = {0,1,2,3... 100), 0= {100,200,300,400,500). Determine if the following statements are true or false and explain your reasoning. a) NCM b) 0 C M c) O and N have at least one element in common d) O≤ N e) o≤o 1arrow_forward4) Which of the following universal sets has W = {12,79, 44, 18) as a subset? Choose one. a) T = {12,9,76,333, 44, 99, 1000, 2} b) V = {44,76, 12, 99, 18,900,79,2} c) Y = {76,90, 800, 44, 99, 55, 22} d) x = {79,66,71, 4, 18, 22,99,2}arrow_forward
- 3) What is the universal set that contains all possible integers from 1 to 8 inclusive? Choose one. a) A = {1, 1.5, 2, 2.5, 3, 3.5, 4, 4.5, 5, 5.5, 6, 6.5, 7, 7.5, 8} b) B={-1,0,1,2,3,4,5,6,7,8} c) C={1,2,3,4,5,6,7,8} d) D = {0,1,2,3,4,5,6,7,8}arrow_forwardA smallish urn contains 25 small plastic bunnies – 7 of which are pink and 18 of which are white. 10 bunnies are drawn from the urn at random with replacement, and X is the number of pink bunnies that are drawn. (a) P(X = 5) ≈ (b) P(X<6) ≈ The Whoville small urn contains 100 marbles – 60 blue and 40 orange. The Grinch sneaks in one night and grabs a simple random sample (without replacement) of 15 marbles. (a) The probability that the Grinch gets exactly 6 blue marbles is [ Select ] ["≈ 0.054", "≈ 0.043", "≈ 0.061"] . (b) The probability that the Grinch gets at least 7 blue marbles is [ Select ] ["≈ 0.922", "≈ 0.905", "≈ 0.893"] . (c) The probability that the Grinch gets between 8 and 12 blue marbles (inclusive) is [ Select ] ["≈ 0.801", "≈ 0.760", "≈ 0.786"] . The Whoville small urn contains 100 marbles – 60 blue and 40 orange. The Grinch sneaks in one night and grabs a simple random sample (without replacement) of 15 marbles. (a)…arrow_forwardUsing Karnaugh maps and Gray coding, reduce the following circuit represented as a table and write the final circuit in simplest form (first in terms of number of gates then in terms of fan-in of those gates).arrow_forward

 Trigonometry (MindTap Course List)TrigonometryISBN:9781337278461Author:Ron LarsonPublisher:Cengage Learning
 Glencoe Algebra 1, Student Edition, 9780079039897...AlgebraISBN:9780079039897Author:CarterPublisher:McGraw Hill
 College Algebra (MindTap Course List)AlgebraISBN:9781305652231Author:R. David Gustafson, Jeff HughesPublisher:Cengage Learning
 Algebra and Trigonometry (MindTap Course List)AlgebraISBN:9781305071742Author:James Stewart, Lothar Redlin, Saleem WatsonPublisher:Cengage Learning
 College AlgebraAlgebraISBN:9781305115545Author:James Stewart, Lothar Redlin, Saleem WatsonPublisher:Cengage Learning