
Intro Stats, Books a la Carte Edition (5th Edition)
5th Edition
ISBN: 9780134210285
Author: Richard D. De Veaux, Paul Velleman, David E. Bock
Publisher: PEARSON
expand_more
expand_more
format_list_bulleted
Concept explainers
Videos
Textbook Question
Chapter 13, Problem 10E
Character recognition, again The automatic character recognition device discussed in Exercise 4 successfully reads about 85% of handwritten credit card applications. In Exercise 4, you looked at the histograms showing distributions of sample proportions from 1000 simulated samples of size 20, 50, 75, and 100. The sample statistics and theoretical values for each simulation are as follows:
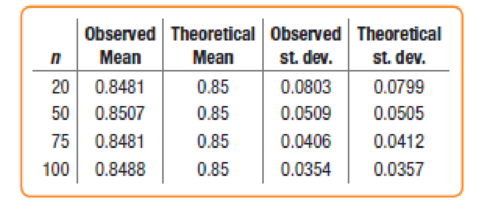
- a) Looking at the histograms in Exercise 4, at what
sample size would you be comfortable using the Normal model as an approximation for the sampling distribution? - b) What does the Success/Failure Condition say about the choice you made in part a?
Expert Solution & Answer
Want to see the full answer?
Check out a sample textbook solution
Students have asked these similar questions
Why researchers are interested in describing measures of the center and measures of variation of a data set?
WHAT IS THE SOLUTION?
The following ordered data list shows the data speeds for cell phones used by a
telephone company at an airport:
A. Calculate the Measures of Central Tendency from the ungrouped data list.
B. Group the data in an appropriate frequency table.
C. Calculate the Measures of Central Tendency using the table in point B.
0.8
1.4
1.8
1.9
3.2
3.6
4.5
4.5
4.6
6.2
6.5
7.7
7.9
9.9
10.2
10.3
10.9
11.1
11.1
11.6
11.8
12.0
13.1
13.5
13.7
14.1
14.2
14.7
15.0
15.1
15.5
15.8
16.0
17.5
18.2
20.2
21.1
21.5
22.2
22.4
23.1
24.5
25.7
28.5
34.6
38.5
43.0
55.6
71.3
77.8
Chapter 13 Solutions
Intro Stats, Books a la Carte Edition (5th Edition)
Ch. 13.2 - You want to poll a random sample of 100 students...Ch. 13.2 - Prob. 2JCCh. 13.2 - If you think that about half the students are in...Ch. 13.3 - A Pew Research study regarding cell phones asked...Ch. 13.3 - Prob. 5JCCh. 13.3 - A Pew Research study regarding cell phones asked...Ch. 13.3 - Prob. 7JCCh. 13.3 - Prob. 8JCCh. 13.5 - Prob. 9JCCh. 13.5 - Prob. 10JC
Ch. 13.5 - Prob. 11JCCh. 13 - Website An investment company is planning to...Ch. 13 - Marketing The proportion of adult women in the...Ch. 13 - Prob. 3ECh. 13 - Character recognition An automatic character...Ch. 13 - Prob. 5ECh. 13 - Hows life? Gallup regularly conducts a poll using...Ch. 13 - Prob. 7ECh. 13 - Prob. 8ECh. 13 - Send more money The philanthropic organization in...Ch. 13 - Character recognition, again The automatic...Ch. 13 - Prob. 11ECh. 13 - Prob. 12ECh. 13 - Prob. 13ECh. 13 - Spanking In a 2015 Pew Research study on trends in...Ch. 13 - Prob. 15ECh. 13 - Smoking The Gallup poll described in Exercise 6...Ch. 13 - Prob. 17ECh. 13 - Prob. 18ECh. 13 - Graduation Its believed that as many as 25% of...Ch. 13 - Hiring In preparing a report on the economy, we...Ch. 13 - Margin of error A TV newscaster reports the...Ch. 13 - Another margin of error A medical researcher...Ch. 13 - Conditions For each situation described below,...Ch. 13 - More conditions Consider each situation described....Ch. 13 - Conclusions A catalog sales company promises to...Ch. 13 - More conclusions In January 2002, two students...Ch. 13 - Confidence intervals Several factors are involved...Ch. 13 - Confidence intervals, again Several factors are...Ch. 13 - Cars What fraction of cars made in Japan? The...Ch. 13 - Prob. 30ECh. 13 - Mislabeled seafood In 2013 the environmental group...Ch. 13 - Mislabeled seafood, second course A Consumer...Ch. 13 - Prob. 33ECh. 13 - Prob. 34ECh. 13 - Prob. 35ECh. 13 - Take the offer First USA, a major credit card...Ch. 13 - Teenage drivers An insurance company checks police...Ch. 13 - Junk mail Direct mail advertisers send...Ch. 13 - Prob. 39ECh. 13 - Prob. 40ECh. 13 - Prob. 41ECh. 13 - Gambling A city ballot includes a local initiative...Ch. 13 - Rickets Vitamin D, whether ingested as a dietary...Ch. 13 - Teachers A 2011 Gallup poll found that 76% of...Ch. 13 - Prob. 45ECh. 13 - Back to campus ACT, Inc. reported that 74% of 1644...Ch. 13 - Deer ticks Wildlife biologists inspect 153 deer...Ch. 13 - Prob. 48ECh. 13 - Graduation, again As in Exercise 19, we hope to...Ch. 13 - Better hiring info Editors of the business report...Ch. 13 - Prob. 51ECh. 13 - Another pilot study During routine screening, a...Ch. 13 - Prob. 53ECh. 13 - Amendment A TV news reporter says that a proposed...
Knowledge Booster


Learn more about
Need a deep-dive on the concept behind this application? Look no further. Learn more about this topic, statistics and related others by exploring similar questions and additional content below.Similar questions
- II Consider the following data matrix X: X1 X2 0.5 0.4 0.2 0.5 0.5 0.5 10.3 10 10.1 10.4 10.1 10.5 What will the resulting clusters be when using the k-Means method with k = 2. In your own words, explain why this result is indeed expected, i.e. why this clustering minimises the ESS map.arrow_forwardwhy the answer is 3 and 10?arrow_forwardPS 9 Two films are shown on screen A and screen B at a cinema each evening. The numbers of people viewing the films on 12 consecutive evenings are shown in the back-to-back stem-and-leaf diagram. Screen A (12) Screen B (12) 8 037 34 7 6 4 0 534 74 1645678 92 71689 Key: 116|4 represents 61 viewers for A and 64 viewers for B A second stem-and-leaf diagram (with rows of the same width as the previous diagram) is drawn showing the total number of people viewing films at the cinema on each of these 12 evenings. Find the least and greatest possible number of rows that this second diagram could have. TIP On the evening when 30 people viewed films on screen A, there could have been as few as 37 or as many as 79 people viewing films on screen B.arrow_forward
- Q.2.4 There are twelve (12) teams participating in a pub quiz. What is the probability of correctly predicting the top three teams at the end of the competition, in the correct order? Give your final answer as a fraction in its simplest form.arrow_forwardThe table below indicates the number of years of experience of a sample of employees who work on a particular production line and the corresponding number of units of a good that each employee produced last month. Years of Experience (x) Number of Goods (y) 11 63 5 57 1 48 4 54 5 45 3 51 Q.1.1 By completing the table below and then applying the relevant formulae, determine the line of best fit for this bivariate data set. Do NOT change the units for the variables. X y X2 xy Ex= Ey= EX2 EXY= Q.1.2 Estimate the number of units of the good that would have been produced last month by an employee with 8 years of experience. Q.1.3 Using your calculator, determine the coefficient of correlation for the data set. Interpret your answer. Q.1.4 Compute the coefficient of determination for the data set. Interpret your answer.arrow_forwardCan you answer this question for mearrow_forward
- Techniques QUAT6221 2025 PT B... TM Tabudi Maphoru Activities Assessments Class Progress lIE Library • Help v The table below shows the prices (R) and quantities (kg) of rice, meat and potatoes items bought during 2013 and 2014: 2013 2014 P1Qo PoQo Q1Po P1Q1 Price Ро Quantity Qo Price P1 Quantity Q1 Rice 7 80 6 70 480 560 490 420 Meat 30 50 35 60 1 750 1 500 1 800 2 100 Potatoes 3 100 3 100 300 300 300 300 TOTAL 40 230 44 230 2 530 2 360 2 590 2 820 Instructions: 1 Corall dawn to tha bottom of thir ceraan urina se se tha haca nariad in archerca antarand cubmit Q Search ENG US 口X 2025/05arrow_forwardThe table below indicates the number of years of experience of a sample of employees who work on a particular production line and the corresponding number of units of a good that each employee produced last month. Years of Experience (x) Number of Goods (y) 11 63 5 57 1 48 4 54 45 3 51 Q.1.1 By completing the table below and then applying the relevant formulae, determine the line of best fit for this bivariate data set. Do NOT change the units for the variables. X y X2 xy Ex= Ey= EX2 EXY= Q.1.2 Estimate the number of units of the good that would have been produced last month by an employee with 8 years of experience. Q.1.3 Using your calculator, determine the coefficient of correlation for the data set. Interpret your answer. Q.1.4 Compute the coefficient of determination for the data set. Interpret your answer.arrow_forwardQ.3.2 A sample of consumers was asked to name their favourite fruit. The results regarding the popularity of the different fruits are given in the following table. Type of Fruit Number of Consumers Banana 25 Apple 20 Orange 5 TOTAL 50 Draw a bar chart to graphically illustrate the results given in the table.arrow_forward
- Q.2.3 The probability that a randomly selected employee of Company Z is female is 0.75. The probability that an employee of the same company works in the Production department, given that the employee is female, is 0.25. What is the probability that a randomly selected employee of the company will be female and will work in the Production department? Q.2.4 There are twelve (12) teams participating in a pub quiz. What is the probability of correctly predicting the top three teams at the end of the competition, in the correct order? Give your final answer as a fraction in its simplest form.arrow_forwardQ.2.1 A bag contains 13 red and 9 green marbles. You are asked to select two (2) marbles from the bag. The first marble selected will not be placed back into the bag. Q.2.1.1 Construct a probability tree to indicate the various possible outcomes and their probabilities (as fractions). Q.2.1.2 What is the probability that the two selected marbles will be the same colour? Q.2.2 The following contingency table gives the results of a sample survey of South African male and female respondents with regard to their preferred brand of sports watch: PREFERRED BRAND OF SPORTS WATCH Samsung Apple Garmin TOTAL No. of Females 30 100 40 170 No. of Males 75 125 80 280 TOTAL 105 225 120 450 Q.2.2.1 What is the probability of randomly selecting a respondent from the sample who prefers Garmin? Q.2.2.2 What is the probability of randomly selecting a respondent from the sample who is not female? Q.2.2.3 What is the probability of randomly…arrow_forwardTest the claim that a student's pulse rate is different when taking a quiz than attending a regular class. The mean pulse rate difference is 2.7 with 10 students. Use a significance level of 0.005. Pulse rate difference(Quiz - Lecture) 2 -1 5 -8 1 20 15 -4 9 -12arrow_forward
arrow_back_ios
SEE MORE QUESTIONS
arrow_forward_ios
Recommended textbooks for you
 Glencoe Algebra 1, Student Edition, 9780079039897...AlgebraISBN:9780079039897Author:CarterPublisher:McGraw Hill
 College Algebra (MindTap Course List)AlgebraISBN:9781305652231Author:R. David Gustafson, Jeff HughesPublisher:Cengage Learning
Glencoe Algebra 1, Student Edition, 9780079039897...
Algebra
ISBN:9780079039897
Author:Carter
Publisher:McGraw Hill
College Algebra (MindTap Course List)
Algebra
ISBN:9781305652231
Author:R. David Gustafson, Jeff Hughes
Publisher:Cengage Learning
Statistics 4.1 Point Estimators; Author: Dr. Jack L. Jackson II;https://www.youtube.com/watch?v=2MrI0J8XCEE;License: Standard YouTube License, CC-BY
Statistics 101: Point Estimators; Author: Brandon Foltz;https://www.youtube.com/watch?v=4v41z3HwLaM;License: Standard YouTube License, CC-BY
Central limit theorem; Author: 365 Data Science;https://www.youtube.com/watch?v=b5xQmk9veZ4;License: Standard YouTube License, CC-BY
Point Estimate Definition & Example; Author: Prof. Essa;https://www.youtube.com/watch?v=OTVwtvQmSn0;License: Standard Youtube License
Point Estimation; Author: Vamsidhar Ambatipudi;https://www.youtube.com/watch?v=flqhlM2bZWc;License: Standard Youtube License