Student's Solutions Manual for Thinking Mathematically
7th Edition
ISBN: 9780134686509
Author: Robert F. Blitzer
Publisher: PEARSON
expand_more
expand_more
format_list_bulleted
Concept explainers
Videos
Textbook Question
Chapter 12.6, Problem 12E
The
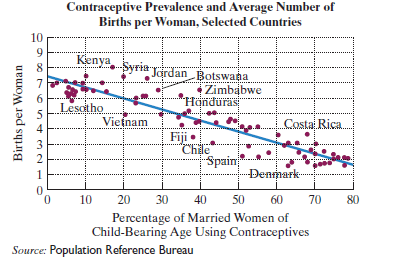
There is a causal relationship between contraceptive use and births per woman.
Expert Solution & Answer
Want to see the full answer?
Check out a sample textbook solution
Students have asked these similar questions
Question 5. We consider a put option with strike price K and expiration T. This option is
priced using a 1-period CRR model. We consider r > 0, and σ > 0 very large. What is the
approximate price of the option? In other words, what is the limit of the price of the option as
σ∞. (Briefly justify your answer.)
Question 6. You collect daily data for the stock of a company Z over the past 4 months (i.e. 80
days) and calculate the log-returns (yk)/(-1. You want to build a CRR model for the evolution
of the stock. The expected value and standard deviation of the log-returns are y = 0.06 and
Sy 0.1. The money market interest rate is r = 0.04. Determine the risk-neutral probability of
the model.
Several markets (Japan, Switzerland) introduced negative interest rates on their money market.
In this problem, we will consider an annual interest rate r < 0. We consider a stock modeled
by an N-period CRR model where each period is 1 year (At = 1) and the up and down factors
are u and d.
(a) We consider an American put option with strike price K and expiration T. Prove that if
<0, the optimal strategy is to wait until expiration T to exercise.
Chapter 12 Solutions
Student's Solutions Manual for Thinking Mathematically
Ch. 12.1 - CHECK POINT 1 A city government wants to conduct a...Ch. 12.1 - CHECK POINT 2 Explain why the sampling technique...Ch. 12.1 - CHECK POINT 3 Construct a frequency distribution...Ch. 12.1 - CHECK POINT 4 Use the classes in Table 12.3 to...Ch. 12.1 - CHECKPOINTS 5 Construct a stem-and-leaf plot for...Ch. 12.1 - A sample obtained in such a way that every member...Ch. 12.1 - Prob. 2CVCCh. 12.1 - Fill in each blank so that the resulting statement...Ch. 12.1 - 4. Data can be displayed using a bar graph with...Ch. 12.1 - Prob. 5CVC
Ch. 12.1 - A data presentation that separates each data item...Ch. 12.1 - In Exercises 7-10, determine whether each...Ch. 12.1 - Prob. 8CVCCh. 12.1 - In Exercises 7-10, determine whether each...Ch. 12.1 - Fill in each blank so that the resulting statement...Ch. 12.1 - 1. The government of a large city needs to...Ch. 12.1 - The city council of a large city needs to know...Ch. 12.1 - A questionnaire was given to students in an...Ch. 12.1 - A questionnaire was given to students in an...Ch. 12.1 - A questionnaire was given to students in an...Ch. 12.1 - A questionnaire was given to students in an...Ch. 12.1 - 7. A random sample of 30 college students is...Ch. 12.1 - 8. A random sample of 30 male college students is...Ch. 12.1 - A college professor had students keep a diary of...Ch. 12.1 - A college professor had students keep a diary of...Ch. 12.1 - A college professor had students keep a diary of...Ch. 12.1 - A college professor had students keep a diary of...Ch. 12.1 - A college professor had students keep a diary of...Ch. 12.1 - A college professor had students keep a diary of...Ch. 12.1 - A college professor had students keep a diary of...Ch. 12.1 - A college professor had students keep a diary of...Ch. 12.1 - The IQ scores of 70 students enrolled in a liberal...Ch. 12.1 - Construct a histogram and a frequency polygon for...Ch. 12.1 - 20. Construct a histogram and a frequency polygon...Ch. 12.1 - 21. Construct a histogram and a frequency polygon...Ch. 12.1 - In Exercises 22-25, determine whether each...Ch. 12.1 - In Exercises 22-25, determine whether each...Ch. 12.1 - In Exercises 22-25, determine whether each...Ch. 12.1 - In Exercises 22-25, determine whether each...Ch. 12.1 - The frequency polygon shows a distribution of IQ...Ch. 12.1 - The frequency polygon shows a distribution of IQ...Ch. 12.1 - The frequency polygon shows a distribution of IQ...Ch. 12.1 - The frequency polygon shows a distribution of IQ...Ch. 12.1 - 30. Construct a stem-and-leaf plot for the data in...Ch. 12.1 - 31. A random sample of 40 college professors is...Ch. 12.1 - In "Ages of Oscar-Winning Best Actors and...Ch. 12.1 - Prob. 33ECh. 12.1 - Prob. 34ECh. 12.1 - Prob. 35ECh. 12.1 - In Exercises 33-37, describe what is misleading in...Ch. 12.1 - In Exercises 33-37, describe what is misleading in...Ch. 12.1 - What is a population? What is a sample?Ch. 12.1 - Prob. 39ECh. 12.1 - 40. Suppose you are interested in whether or not...Ch. 12.1 - For Exercise 40, would questioning every fifth...Ch. 12.1 - What is a frequency distribution?Ch. 12.1 - What is a histogram?Ch. 12.1 - What is a frequency polygon?Ch. 12.1 - 45. Describe how to construct a frequency polygon...Ch. 12.1 - Prob. 46ECh. 12.1 - Prob. 47ECh. 12.1 - Make Sense? In Exercises 48-51, determine whether...Ch. 12.1 - Make Sense? In Exercises 48-51, determine whether...Ch. 12.1 - Make Sense? In Exercises 48-51, determine whether...Ch. 12.1 - Make Sense? In Exercises 48-51, determine whether...Ch. 12.1 - 52. Construct a grouped frequency distribution for...Ch. 12.1 - The classic book on distortion using statistics is...Ch. 12.1 - 54. Each group member should find one example of a...Ch. 12.2 - CHECK POINT 1 Use Figure 12.6 to find the mean...Ch. 12.2 - $$ CHECK POINT 2 Find the mean, $$, for the data...Ch. 12.2 - CHECK POINT 3 Find the median for each of the...Ch. 12.2 - CHECK POINT 4 Find the median for the following...Ch. 12.2 - CHECK POINT 5 Arrange the data items for eating in...Ch. 12.2 - CHECK POINT 6 Find the median for the following...Ch. 12.2 - CHECK POINT 7 Table 12.9 shows the net worth, in...Ch. 12.2 - CHECK POINT 8 Find the mode for each of the...Ch. 12.2 - CHECK POINT 9 Use Table 12.12 on the previous page...Ch. 12.2 - CHECK POINT 10 Consumer Reports magazine gave the...Ch. 12.2 - 1. the sum of all the data items divided by the...Ch. 12.2 - 2. The measure of central tendency that is the...Ch. 12.2 - Prob. 3CVCCh. 12.2 - Prob. 4CVCCh. 12.2 - Prob. 5CVCCh. 12.2 - In Exercises 6-9, determine whether each statement...Ch. 12.2 - Prob. 7CVCCh. 12.2 - In Exercises 6-9, determine whether each statement...Ch. 12.2 - In Exercises 6-9, determine whether each statement...Ch. 12.2 - In Exercises 1-8, find the mean for each group of...Ch. 12.2 - In Exercises 1-8, find the mean for each group of...Ch. 12.2 - Prob. 3ECh. 12.2 - In Exercises 1-8, find the mean for each group of...Ch. 12.2 - In Exercises 1-8, find the mean for each group of...Ch. 12.2 - In Exercises 1-8, find the mean for each group of...Ch. 12.2 - Prob. 7ECh. 12.2 - In Exercises 1-8, find the mean for each group of...Ch. 12.2 - In Exercises 9-12, find the mean for the data...Ch. 12.2 - In Exercises 9-12, find the mean for the data...Ch. 12.2 - In Exercises 9-12, find the mean for the data...Ch. 12.2 - In Exercises 9-12, find the mean for the data...Ch. 12.2 - In Exercises 13-20, find the median for each group...Ch. 12.2 - In Exercises 13-20, find the median for each group...Ch. 12.2 - In Exercises 13-20, find the median for each group...Ch. 12.2 - In Exercises 13-20, find the median for each group...Ch. 12.2 - In Exercises 13-20, find the median for each group...Ch. 12.2 - Prob. 18ECh. 12.2 - In Exercises 13-20, find the median for each group...Ch. 12.2 - In Exercises 13-20, find the median for each group...Ch. 12.2 - Find the median for the data items in the...Ch. 12.2 - Prob. 22ECh. 12.2 - Find the median for the data items in the...Ch. 12.2 - Find the median for the data items in the...Ch. 12.2 - In Exercises 25-32, find the mode for each group...Ch. 12.2 - Prob. 26ECh. 12.2 - In Exercises 25-32, find the mode for each group...Ch. 12.2 - In Exercises 25-32, find the mode for each group...Ch. 12.2 - In Exercises 25-32, find the mode for each group...Ch. 12.2 - In Exercises 25-32, find the mode for each group...Ch. 12.2 - In Exercises 25-32, find the mode for each group...Ch. 12.2 - In Exercises 25-32, find the mode for each group...Ch. 12.2 - Prob. 33ECh. 12.2 - Find the mode for the data items in the frequency...Ch. 12.2 - Prob. 35ECh. 12.2 - Find the mode for the data items in the frequency...Ch. 12.2 - In Exercises 37-44, find the midrange for each...Ch. 12.2 - Prob. 38ECh. 12.2 - In Exercises 37-44, find the midrange for each...Ch. 12.2 - In Exercises 37-44, find the midrange for each...Ch. 12.2 - In Exercises 37-44, find the midrange for each...Ch. 12.2 - Prob. 42ECh. 12.2 - Prob. 43ECh. 12.2 - In Exercises 37-44, find the midrange for each...Ch. 12.2 - Prob. 45ECh. 12.2 - Prob. 46ECh. 12.2 - Find the midrange for the data items in the...Ch. 12.2 - Find the midrange for the data items in the...Ch. 12.2 - In Exercises 49-54, use each display of data items...Ch. 12.2 - In Exercises 49-54, use each display of data items...Ch. 12.2 - In Exercises 49-54, use each display of data items...Ch. 12.2 - In Exercises 49-54, use each display of data items...Ch. 12.2 - Prob. 53ECh. 12.2 - In Exercises 49-54, use each display of data items...Ch. 12.2 - Exercises 55-57 present data on a variety of...Ch. 12.2 - Exercises 55-57 present data on a variety of...Ch. 12.2 - Prob. 57ECh. 12.2 - The weights (to the nearest five pounds) of 40...Ch. 12.2 - Prob. 59ECh. 12.2 - The weights (to the nearest five pounds) of 40...Ch. 12.2 - The weights (to the nearest five pounds) of 40...Ch. 12.2 - 62. An advertisement for a speed-reading course...Ch. 12.2 - Prob. 63ECh. 12.2 - 64. What is the mean and how is it obtained?
Ch. 12.2 - Prob. 65ECh. 12.2 - Prob. 66ECh. 12.2 - Prob. 67ECh. 12.2 - 68. The "average" income in the United States can...Ch. 12.2 - Prob. 69ECh. 12.2 - Prob. 70ECh. 12.2 - A student's parents promise to pay for next...Ch. 12.2 - According to the National Oceanic and Atmospheric...Ch. 12.2 - Prob. 73ECh. 12.2 - Make Sense? In Exercises 73-76, determine whether...Ch. 12.2 - Prob. 75ECh. 12.2 - Make Sense? Exercises 73-76, determine whether...Ch. 12.2 - Prob. 77ECh. 12.2 - On an examination given to 30 students, no student...Ch. 12.2 - Select a characteristic, such as shoe size or...Ch. 12.2 - A book on spotting bad statistics and learning to...Ch. 12.3 - CHECKPOINT 1 Find the range for the following...Ch. 12.3 - CHECK POINT 2 Compute the mean for the following...Ch. 12.3 - CHECK POINT 3 Find the standard deviation for the...Ch. 12.3 - CHECK POINT 4 Find the standard deviation of the...Ch. 12.3 - CHECK POINT 5 Shown below are the means and...Ch. 12.3 - Fill in each blank so that the resulting statement...Ch. 12.3 - Fill in each blank so that the resulting statement...Ch. 12.3 - Fill in each blank so that the resulting statement...Ch. 12.3 - Fill in each blank so that the resulting statement...Ch. 12.3 - Fill in each blank so that the resulting statement...Ch. 12.3 - In Exercises 1-6, find the range for each group of...Ch. 12.3 - In Exercises 1-6, find the range for each group of...Ch. 12.3 - In Exercises 1-6, find the range for each group of...Ch. 12.3 - In Exercises 1-6, find the range for each group of...Ch. 12.3 - In Exercises 1-6, find the range for each group of...Ch. 12.3 - Prob. 6ECh. 12.3 - In Exercises 7-10, a group of data items and their...Ch. 12.3 - In Exercises 7-10, a group of data items and their...Ch. 12.3 - In Exercises 7-10, a group of data items and their...Ch. 12.3 - Prob. 10ECh. 12.3 - In Exercises 11-16, find a. the mean; b. the...Ch. 12.3 - In Exercises 11-16, find a. the mean; b. the...Ch. 12.3 - Prob. 13ECh. 12.3 - Prob. 14ECh. 12.3 - In Exercises 11-16, find a. the mean; b. the...Ch. 12.3 - In Exercises 11-16, find a. the mean; b. the...Ch. 12.3 - In Exercises 17-26, find the standard deviation...Ch. 12.3 - Prob. 18ECh. 12.3 - Prob. 19ECh. 12.3 - In Exercises 17-26, find the standard deviation...Ch. 12.3 - In Exercises 17-26, find the standard deviation...Ch. 12.3 - In Exercises 17-26, find the standard deviation...Ch. 12.3 - Prob. 23ECh. 12.3 - In Exercises 17-26, find the standard deviation...Ch. 12.3 - Prob. 25ECh. 12.3 - In Exercises 17-26, find the standard deviation...Ch. 12.3 - In Exercises 27-28, compute the mean, range, and...Ch. 12.3 - In Exercises 27-28, compute the mean, range, and...Ch. 12.3 - In Exercises 29-36, use each display of data items...Ch. 12.3 - In Exercises 29-36, use each display of data items...Ch. 12.3 - In Exercises 29-36, use each display of data items...Ch. 12.3 - In Exercises 29-36, use each display of data items...Ch. 12.3 - In Exercises 29-36, use each display of data items...Ch. 12.3 - In Exercises 29-36, use each display of data items...Ch. 12.3 - Prob. 35ECh. 12.3 - In Exercises 29-36, use each display of data items...Ch. 12.3 - The data sets give the number of platinum albums...Ch. 12.3 - The data sets give the ages of the first six U.S....Ch. 12.3 - Describe how to find the range of a data set.Ch. 12.3 - Describe why the range might not be the best...Ch. 12.3 - Describe how the standard deviation is computed.Ch. 12.3 - 42. Describe what the standard deviation reveals...Ch. 12.3 - If a set of test scores has a standard deviation...Ch. 12.3 - Two classes took a statistics test. Both classes...Ch. 12.3 - Prob. 45ECh. 12.3 - Over a one-month period, stock A had a mean daily...Ch. 12.3 - Make Sense? Exercises 47-50, determine whether...Ch. 12.3 - Prob. 48ECh. 12.3 - Make Sense? In Exercises 47-50, determine whether...Ch. 12.3 - Make Sense? Exercises 47-50, determine whether...Ch. 12.3 - 51. Describe a situation in which a relatively...Ch. 12.3 - If a set of test scores has a large range but a...Ch. 12.3 - Prob. 53ECh. 12.3 - Use the data 0, 1, 3, 4, 4, 6. Add 2 to each of...Ch. 12.3 - Prob. 55ECh. 12.3 - 56. Group members should consult a current almanac...Ch. 12.4 - CHECK POINT 1 Female adult heights in North...Ch. 12.4 - CHECK POINT 2 Use the distribution of male adult...Ch. 12.4 - CHECK POINT 3 The length of horse pregnancies from...Ch. 12.4 - CHECK POINT 4 The SAT (Scholastic Aptitude Test)...Ch. 12.4 - CHECK POINT 5 Use the information in Example 5 to...Ch. 12.4 - CHECK POINT 6 A student scored in the 75th...Ch. 12.4 - CHECK POINI 7 A Harris Poll of 2513 US. adults...Ch. 12.4 - Prob. 1CVCCh. 12.4 - Prob. 2CVCCh. 12.4 - Fill in each blank so that the resulting statement...Ch. 12.4 - Prob. 4CVCCh. 12.4 - Prob. 5CVCCh. 12.4 - Prob. 6CVCCh. 12.4 - Prob. 7CVCCh. 12.4 - Prob. 8CVCCh. 12.4 - The scores on a test are normally distributed with...Ch. 12.4 - The scores on a test are normally distributed with...Ch. 12.4 - The scores on a test are normally distributed with...Ch. 12.4 - The scores on a test are normally distributed with...Ch. 12.4 - Prob. 5ECh. 12.4 - The scores on a test are normally distributed with...Ch. 12.4 - The scores on a test are normally distributed with...Ch. 12.4 - The scores on a test are normally distributed with...Ch. 12.4 - Prob. 9ECh. 12.4 - The scores on a test are normally distributed with...Ch. 12.4 - Not everyone pays the same price for the same...Ch. 12.4 - Not everyone pays the same price for the same...Ch. 12.4 - Not everyone pays the same price for the same...Ch. 12.4 - Not everyone pays the same price for the same...Ch. 12.4 - Not everyone pays the same price for the same...Ch. 12.4 - Not everyone pays the same price for the same...Ch. 12.4 - Not everyone pays the same price for the same...Ch. 12.4 - Prob. 18ECh. 12.4 - Not everyone pays the same price for the same...Ch. 12.4 - Not everyone pays the same price for the same...Ch. 12.4 - Not everyone pays the same price for the same...Ch. 12.4 - Prob. 22ECh. 12.4 - Intelligence quotients (IQs) on the Stanford-Binet...Ch. 12.4 - Intelligence quotients (IQs) on the Stanford-...Ch. 12.4 - Intelligence quotients (IQs) on the Stanford-...Ch. 12.4 - Intelligence quotients (IQs) on the Stanford-...Ch. 12.4 - Intelligence quotients (IQs) on the Stanford-Binet...Ch. 12.4 - Intelligence quotients (IQs) on the Stanford-Binet...Ch. 12.4 - Intelligence quotients (IQs) on the Stanford-...Ch. 12.4 - Intelligence quotients (IQs) on the Stanford-...Ch. 12.4 - Intelligence quotients (IQs) on the Stanford-...Ch. 12.4 - Intelligence quotients (IQs) on the Stanford-Binet...Ch. 12.4 - Prob. 33ECh. 12.4 - A set of data items is normally distributed with a...Ch. 12.4 - Prob. 35ECh. 12.4 - A set of data items is normally distributed with a...Ch. 12.4 - A set of data items is normally distributed with a...Ch. 12.4 - Prob. 38ECh. 12.4 - A set of data items is normally distributed with a...Ch. 12.4 - A set of data items is normally distributed with a...Ch. 12.4 - A set of data items is normally distributed with a...Ch. 12.4 - Prob. 42ECh. 12.4 - Prob. 43ECh. 12.4 - A set of data items is normally distributed with a...Ch. 12.4 - A set of data items is normally distributed with a...Ch. 12.4 - A set of data items is normally distributed with a...Ch. 12.4 - Prob. 47ECh. 12.4 - A set of data items is normally distributed with a...Ch. 12.4 - Scores on a denial anxiety scale range from 0 (no...Ch. 12.4 - Prob. 50ECh. 12.4 - Scores on a denial anxiety scale range from 0 (no...Ch. 12.4 - Scores on a denial anxiety scale range from 0 (no...Ch. 12.4 - Prob. 53ECh. 12.4 - Scores on a denial anxiety scale range from 0 (no...Ch. 12.4 - Prob. 55ECh. 12.4 - Scores on a denial anxiety scale range from 0 (no...Ch. 12.4 - Intelligence quotients on the Stanford-Binet...Ch. 12.4 - Prob. 58ECh. 12.4 - A set of data items is normally distributed with a...Ch. 12.4 - A set of data items is normally distributed with a...Ch. 12.4 - A set of data items is normally distributed with a...Ch. 12.4 - A set of data items is normally distributed with a...Ch. 12.4 - Prob. 63ECh. 12.4 - A set of data items is normally distributed with a...Ch. 12.4 - A set of data items is normally distributed with a...Ch. 12.4 - A set of data items is normally distributed with a...Ch. 12.4 - Reducing Gun Violence The data in the bar graph...Ch. 12.4 - How to Blow Your Job Interview The data in the bar...Ch. 12.4 - Prob. 69ECh. 12.4 - Using a random sample of 4000 TV households...Ch. 12.4 - 71. In 1997.Nielsen Media Research increased its...Ch. 12.4 - If Nielsen Media Research were to increase its...Ch. 12.4 - a. Is the shape of this distribution best...Ch. 12.4 - 74. a. Find the median murder rate per 100.000...Ch. 12.4 - 75. What is a symmetric histogram?
Ch. 12.4 - Prob. 76ECh. 12.4 - 77. Describe the 68-95-99.7 Rule.
Ch. 12.4 - Prob. 78ECh. 12.4 - What does a z-score measure?Ch. 12.4 - Prob. 80ECh. 12.4 - 81. Describe when a z-score is negative.
Ch. 12.4 - If you score in the 83rd percentile, what does...Ch. 12.4 - Prob. 83ECh. 12.4 - Prob. 84ECh. 12.4 - Prob. 85ECh. 12.4 - Give an example of a phenomenon that is not...Ch. 12.4 - Make Sense? In Exercises 87-90, determine whether...Ch. 12.4 - Make Sense? In Exercises 87-90, determine whether...Ch. 12.4 - Make sense? In Exercises 87-90, determine whether...Ch. 12.4 - Make Sense? In Exercises 87-90, determine whether...Ch. 12.5 - CHECK POINT I The distribution of monthly charges...Ch. 12.5 - CHECK POINT 2 Female adult heights in North...Ch. 12.5 - Prob. 3CPCh. 12.5 - Prob. 1CVCCh. 12.5 - Prob. 2CVCCh. 12.5 - Prob. 3CVCCh. 12.5 - Prob. 4CVCCh. 12.5 - Use the information shown below to fill in each...Ch. 12.5 - In Exercises 1-8, find the percentage of data...Ch. 12.5 - In Exercises 1-8, find the percentage of data...Ch. 12.5 - Prob. 3ECh. 12.5 - In Exercises 1-8, find the percentage of data...Ch. 12.5 - Prob. 5ECh. 12.5 - In Exercises 1-8, find the percentage of data...Ch. 12.5 - Prob. 7ECh. 12.5 - In Exercises 1-8, find the percentage of data...Ch. 12.5 - In Exercises 9-16, find the percentage of data...Ch. 12.5 - In Exercises 9-16, find the percentage of data...Ch. 12.5 - In Exercises 9-16, find the percentage of data...Ch. 12.5 - In Exercises 9-16, find the percentage of data...Ch. 12.5 - In Exercises 9-16, find the percentage of data...Ch. 12.5 - In Exercises 9-16, find the percentage of data...Ch. 12.5 - Prob. 15ECh. 12.5 - In Exercises 9-16, find the percentage of data...Ch. 12.5 - Systolic blood pressure readings are normally...Ch. 12.5 - Systolic blood pressure readings are normally...Ch. 12.5 - Systolic blood pressure readings are normally...Ch. 12.5 - Systolic blood pressure readings are normally...Ch. 12.5 - Systolic blood pressure readings are normally...Ch. 12.5 - Systolic blood pressure readings are normally...Ch. 12.5 - Prob. 23ECh. 12.5 - Systolic blood pressure readings are normally...Ch. 12.5 - Prob. 25ECh. 12.5 - Systolic blood pressure readings are normally...Ch. 12.5 - Prob. 27ECh. 12.5 - The weights for 12-month-old baby boys are...Ch. 12.5 - The weights for 12-month-old baby boys are...Ch. 12.5 - The weights for 12-month-old baby boys are...Ch. 12.5 - The table shows selected ages of licensed drivers...Ch. 12.5 - The table shows selected ages of licensed drivers...Ch. 12.5 - Prob. 33ECh. 12.5 - The table shows selected ages of licensed drivers...Ch. 12.5 - The table shows selected ages of licensed drivers...Ch. 12.5 - The table shows selected ages of licensed drivers...Ch. 12.5 - Writing in Mathematics
37.
Explain when it is...Ch. 12.5 - Writing in Mathematics Explain how to use a table...Ch. 12.5 - Make Sense? In Exercises 39-42, determine whether...Ch. 12.5 - Make Sense? In Exercises 39-42, determine whether...Ch. 12.5 - Make Sense? In Exercises 39-42, determine whether...Ch. 12.5 - Make Sense? In Exercises 39-42, determine whether...Ch. 12.5 - Find two z-scores so that 40% of the data in the...Ch. 12.5 - 44. A woman insists that she will never marry a...Ch. 12.5 - 45. The placement lest for a college has scores...Ch. 12.6 - CHECK POINT 1 In a 1996 study involving obesity in...Ch. 12.6 - CHECK POINT 2 The points in the scatter plot in...Ch. 12.6 - CHECK POINT 3 Use the data in Figure 1230 of Check...Ch. 12.6 - CHECK POINT 4 If you worked Check Point 2...Ch. 12.6 - Fill in each blank so that the resulting statement...Ch. 12.6 - Fill in each blank so that the resulting statement...Ch. 12.6 - Fill in each blank so that the resulting statement...Ch. 12.6 - Prob. 4CVCCh. 12.6 - Prob. 5CVCCh. 12.6 - Prob. 6CVCCh. 12.6 - In Exercises 4-7, determine whether each statement...Ch. 12.6 - In Exercises 1-8, make a scatter plot for the...Ch. 12.6 - In Exercises 1-8, make a scatter plot for the...Ch. 12.6 - In Exercises 1-8, make a scatter plot for the...Ch. 12.6 - In Exercises 1-8, make a scatter plot for the...Ch. 12.6 - Prob. 5ECh. 12.6 - In Exercises 1-8, make a scatter plot for the...Ch. 12.6 - In Exercises 1-8, make a scatter plot for the...Ch. 12.6 - In Exercises 1-8, make a scatter plot for the...Ch. 12.6 - The scatter plot in the figure shows the...Ch. 12.6 - The scatter plot in the figure shows the...Ch. 12.6 - The scatter plot in the figure shows the...Ch. 12.6 - The scatter plot in the figure shows the...Ch. 12.6 - The scatter plot in the figure shows the...Ch. 12.6 - The scatter plot in the figure shows the...Ch. 12.6 - The scatter plot in the figure shows the...Ch. 12.6 - The scatter plot in the figure shows the...Ch. 12.6 - The scatter plot in the figure shows the...Ch. 12.6 - The scalier plot in the figure shows the...Ch. 12.6 - Prob. 19ECh. 12.6 - Just as money doesn't buy happiness for...Ch. 12.6 - Just as money doesn't buy happiness for...Ch. 12.6 - Just as money doesn't buy happiness for...Ch. 12.6 - Just as money doesn't buy happiness for...Ch. 12.6 - Just as money doesn't buy happiness for...Ch. 12.6 - Just as money doesn't buy happiness for...Ch. 12.6 - Just as money doesn't buy happiness for...Ch. 12.6 - Use the scatter plots shown labeled (a)-(f), to...Ch. 12.6 - Use the scatter plots shown labeled (a)-(f), to...Ch. 12.6 - Use the scatter plots shown labeled (a)-(f), to...Ch. 12.6 - Use the scatter plots shown labeled (a)-(f), to...Ch. 12.6 - Compute r, the correlation coefficient, rounded to...Ch. 12.6 - Compute r, the correlation coefficient, rounded to...Ch. 12.6 - Compute r, the correlation coefficient, rounded to...Ch. 12.6 - Compute r, the correlation coefficient, rounded to...Ch. 12.6 - 35. Use the data in Exercise 5 to solve this...Ch. 12.6 - 36. Use the data in Exercise 6 to solve this...Ch. 12.6 - 37. Use the data in Exercise 7 to solve this...Ch. 12.6 - 38. Use the data in Exercise 8 to solve this...Ch. 12.6 - Prob. 39ECh. 12.6 - In Exercises 39-45, the correlation coefficient,...Ch. 12.6 - In Exercises 39-45, the correlation coefficient,...Ch. 12.6 - Prob. 42ECh. 12.6 - Prob. 43ECh. 12.6 - Prob. 44ECh. 12.6 - Prob. 45ECh. 12.6 - Prob. 46ECh. 12.6 - 47. What is a scatter plot?
Ch. 12.6 - How does a scatter plot indicate that two...Ch. 12.6 - Give an example of two variables with a strong...Ch. 12.6 - 50. Give an example of two variables with a strong...Ch. 12.6 - 51. What is meant by a regression line?
Ch. 12.6 - Prob. 52ECh. 12.6 - Prob. 53ECh. 12.6 - Prob. 54ECh. 12.6 - Prob. 55ECh. 12.6 - Prob. 56ECh. 12.6 - 57. Explain how to use the correlation coefficient...Ch. 12.6 - Prob. 58ECh. 12.6 - Make Sense? In Exercises 58-61, determine whether...Ch. 12.6 - Prob. 60ECh. 12.6 - Make Sense? In Exercises 58-61, determine whether...Ch. 12.6 - Prob. 62ECh. 12.6 - Use the linear regression feature of a graphing...Ch. 12.6 - 64. The group should select two variables related...Ch. 12.6 - Prob. 65ECh. 12 - 1. The government of a large city wants to know if...Ch. 12 - A random sample of ten college students is...Ch. 12 - A random sample of ten college students is...Ch. 12 - Prob. 4RECh. 12 - The 50 grades on a physiology lest are shown. Use...Ch. 12 - The 50 grades on a physiology test are shown. Use...Ch. 12 - Describe what is misleading about the size of the...Ch. 12 - In Exercises 8-9, find the mean for each group of...Ch. 12 - In Exercises 8-9, find the mean for each group of...Ch. 12 - Find the mean for the data items in the given...Ch. 12 - In Exercises 11-12, find the median for each group...Ch. 12 - In Exercises 11-12, find the median for each group...Ch. 12 - Find the median for the data items in the...Ch. 12 - In Exercises 14-15, find the mode for each group...Ch. 12 - In Exercises 14-15, find the mode for each group...Ch. 12 - 16. Find the mode for the data items in the...Ch. 12 - In Exercises 17-18, find the midrange for each...Ch. 12 - Prob. 18RECh. 12 - Prob. 19RECh. 12 - Prob. 20RECh. 12 - The data items below are the ages of U.S....Ch. 12 - Prob. 22RECh. 12 - Prob. 23RECh. 12 - Prob. 24RECh. 12 - Use the data items 36, 26, 24, 90, and 74 to find...Ch. 12 - Prob. 26RECh. 12 - Prob. 27RECh. 12 - Prob. 28RECh. 12 - Prob. 29RECh. 12 - 30. Describe how you would determine
a. which of...Ch. 12 - Prob. 31RECh. 12 - Prob. 32RECh. 12 - Prob. 33RECh. 12 - Prob. 34RECh. 12 - Prob. 35RECh. 12 - Prob. 36RECh. 12 - Prob. 37RECh. 12 - Prob. 38RECh. 12 - Prob. 39RECh. 12 - Prob. 40RECh. 12 - Prob. 41RECh. 12 - Prob. 42RECh. 12 - Prob. 43RECh. 12 - Prob. 44RECh. 12 - Prob. 45RECh. 12 - Prob. 46RECh. 12 - Prob. 47RECh. 12 - Prob. 48RECh. 12 - Prob. 49RECh. 12 - Prob. 50RECh. 12 - The histogram indicates the frequencies of the...Ch. 12 - The mean cholesterol level for all men in the...Ch. 12 - Prob. 53RECh. 12 - The mean cholesterol level for all men in the...Ch. 12 - The mean cholesterol level for all men in the...Ch. 12 - Prob. 56RECh. 12 - Prob. 57RECh. 12 - Prob. 58RECh. 12 - Prob. 59RECh. 12 - Prob. 60RECh. 12 - 61. There is a perfect negative correlation...Ch. 12 - 62. As the percentage of adult females who are...Ch. 12 - 63. The country with the least percentage of adult...Ch. 12 - Prob. 64RECh. 12 - Prob. 65RECh. 12 - Prob. 66RECh. 12 - Prob. 67RECh. 12 - Prob. 68RECh. 12 - Prob. 69RECh. 12 - Prob. 70RECh. 12 - Prob. 1TCh. 12 - Prob. 2TCh. 12 - Prob. 3TCh. 12 - Prob. 4TCh. 12 - Prob. 5TCh. 12 - Prob. 6TCh. 12 - Prob. 7TCh. 12 - Prob. 8TCh. 12 - Prob. 9TCh. 12 - Prob. 10TCh. 12 - Prob. 11TCh. 12 - Prob. 12TCh. 12 - Prob. 13TCh. 12 - Prob. 14TCh. 12 - Prob. 15TCh. 12 - Prob. 16TCh. 12 - Prob. 17TCh. 12 - Prob. 18TCh. 12 - Prob. 19TCh. 12 - 20. Use the percentiles in the table shown below...Ch. 12 - 21. Using a random sample of 100 students from a...Ch. 12 - Prob. 22TCh. 12 - Prob. 23TCh. 12 - Prob. 24TCh. 12 - Prob. 25TCh. 12 - 26. Is the relationship between the price of gas...
Knowledge Booster


Learn more about
Need a deep-dive on the concept behind this application? Look no further. Learn more about this topic, subject and related others by exploring similar questions and additional content below.Similar questions
- We consider an N-period CRR model where each period is 1 year (At = 1), the up factor is u = 0.1, the down factor is d = e−0.3 and r = 0. We remind you that in the CRR model, the stock price at time tn is modeled (under P) by Sta = So exp (μtn + σ√AtZn), where (Zn) is a simple symmetric random walk. (a) Find the parameters μ and σ for the CRR model described above. (b) Find P Ste So 55/50 € > 1). StN (c) Find lim P 804-N (d) Determine q. (You can use e- 1 x.) Ste (e) Find Q So (f) Find lim Q 004-N StN Soarrow_forwardIn this problem, we consider a 3-period stock market model with evolution given in Fig. 1 below. Each period corresponds to one year. The interest rate is r = 0%. 16 22 28 12 16 12 8 4 2 time Figure 1: Stock evolution for Problem 1. (a) A colleague notices that in the model above, a movement up-down leads to the same value as a movement down-up. He concludes that the model is a CRR model. Is your colleague correct? (Explain your answer.) (b) We consider a European put with strike price K = 10 and expiration T = 3 years. Find the price of this option at time 0. Provide the replicating portfolio for the first period. (c) In addition to the call above, we also consider a European call with strike price K = 10 and expiration T = 3 years. Which one has the highest price? (It is not necessary to provide the price of the call.) (d) We now assume a yearly interest rate r = 25%. We consider a Bermudan put option with strike price K = 10. It works like a standard put, but you can exercise it…arrow_forwardIn this problem, we consider a 2-period stock market model with evolution given in Fig. 1 below. Each period corresponds to one year (At = 1). The yearly interest rate is r = 1/3 = 33%. This model is a CRR model. 25 15 9 10 6 4 time Figure 1: Stock evolution for Problem 1. (a) Find the values of up and down factors u and d, and the risk-neutral probability q. (b) We consider a European put with strike price K the price of this option at time 0. == 16 and expiration T = 2 years. Find (c) Provide the number of shares of stock that the replicating portfolio contains at each pos- sible position. (d) You find this option available on the market for $2. What do you do? (Short answer.) (e) We consider an American put with strike price K = 16 and expiration T = 2 years. Find the price of this option at time 0 and describe the optimal exercising strategy. (f) We consider an American call with strike price K ○ = 16 and expiration T = 2 years. Find the price of this option at time 0 and describe…arrow_forward
- No chatgpt pls will upvote Alreadyarrow_forwardFind the LaPla se trnsofrom of a) chi-square Distribution. b) Normal Distribution. C) Gamma Distribution. prove that Binomial (n, 2) Poisson (2) *********************arrow_forward2.2, 13.2-13.3) question: 5 point(s) possible ubmit test The accompanying table contains the data for the amounts (in oz) in cans of a certain soda. The cans are labeled to indicate that the contents are 20 oz of soda. Use the sign test and 0.05 significance level to test the claim that cans of this soda are filled so that the median amount is 20 oz. If the median is not 20 oz, are consumers being cheated? Click the icon to view the data. What are the null and alternative hypotheses? OA. Ho: Medi More Info H₁: Medi OC. Ho: Medi H₁: Medi Volume (in ounces) 20.3 20.1 20.4 Find the test stat 20.1 20.5 20.1 20.1 19.9 20.1 Test statistic = 20.2 20.3 20.3 20.1 20.4 20.5 Find the P-value 19.7 20.2 20.4 20.1 20.2 20.2 P-value= (R 19.9 20.1 20.5 20.4 20.1 20.4 Determine the p 20.1 20.3 20.4 20.2 20.3 20.4 Since the P-valu 19.9 20.2 19.9 Print Done 20 oz 20 oz 20 oz 20 oz ce that the consumers are being cheated.arrow_forward
- T Teenage obesity (O), and weekly fast-food meals (F), among some selected Mississippi teenagers are: Name Obesity (lbs) # of Fast-foods per week Josh 185 10 Karl 172 8 Terry 168 9 Kamie Andy 204 154 12 6 (a) Compute the variance of Obesity, s²o, and the variance of fast-food meals, s², of this data. [Must show full work]. (b) Compute the Correlation Coefficient between O and F. [Must show full work]. (c) Find the Coefficient of Determination between O and F. [Must show full work]. (d) Obtain the Regression equation of this data. [Must show full work]. (e) Interpret your answers in (b), (c), and (d). (Full explanations required). Edit View Insert Format Tools Tablearrow_forwardH.w WI M Wz dy A Sindax Sind ①dlmax У тах at 0.75m from A W=6KN/M L=2 W2 = 9 KN/m P= 10 KN Barrow_forwardNo chatgpt pls will upvotearrow_forward
- Q4*) Find the extremals y, z of the the functional 1 = √² (2yz — 2z² + y² — z¹²) dx, - - with y(0) = 0, y(1) = 1, z(0) = 0, z(1) = 0.arrow_forwardlet h0, h1, h2,..., hn,....be the sequence defined by hn = (n C 2), (n choose 2). (n>=0). Determine the generating function for the sequence.arrow_forwardDraw the triangle and show all the workarrow_forward
arrow_back_ios
SEE MORE QUESTIONS
arrow_forward_ios
Recommended textbooks for you
 Big Ideas Math A Bridge To Success Algebra 1: Stu...AlgebraISBN:9781680331141Author:HOUGHTON MIFFLIN HARCOURTPublisher:Houghton Mifflin Harcourt
 Glencoe Algebra 1, Student Edition, 9780079039897...AlgebraISBN:9780079039897Author:CarterPublisher:McGraw Hill
 Holt Mcdougal Larson Pre-algebra: Student Edition...AlgebraISBN:9780547587776Author:HOLT MCDOUGALPublisher:HOLT MCDOUGAL
 Functions and Change: A Modeling Approach to Coll...AlgebraISBN:9781337111348Author:Bruce Crauder, Benny Evans, Alan NoellPublisher:Cengage Learning
Big Ideas Math A Bridge To Success Algebra 1: Stu...
Algebra
ISBN:9781680331141
Author:HOUGHTON MIFFLIN HARCOURT
Publisher:Houghton Mifflin Harcourt
Glencoe Algebra 1, Student Edition, 9780079039897...
Algebra
ISBN:9780079039897
Author:Carter
Publisher:McGraw Hill
Holt Mcdougal Larson Pre-algebra: Student Edition...
Algebra
ISBN:9780547587776
Author:HOLT MCDOUGAL
Publisher:HOLT MCDOUGAL
Functions and Change: A Modeling Approach to Coll...
Algebra
ISBN:9781337111348
Author:Bruce Crauder, Benny Evans, Alan Noell
Publisher:Cengage Learning
Correlation Vs Regression: Difference Between them with definition & Comparison Chart; Author: Key Differences;https://www.youtube.com/watch?v=Ou2QGSJVd0U;License: Standard YouTube License, CC-BY
Correlation and Regression: Concepts with Illustrative examples; Author: LEARN & APPLY : Lean and Six Sigma;https://www.youtube.com/watch?v=xTpHD5WLuoA;License: Standard YouTube License, CC-BY