
Videos
Chebyshev’s Theorem How can you determine whether a distribution is approximately normal? A statistical theorem called Chebyshev’s theorem states that the minimum percent of data between plus and minus K standard deviations from the mean (K > 1) in any distribution can be found by the formula
Minimum percent =
Thus, for example, between ±2 standard deviations from the mean there will always be a minimum of 75% of data. This minimum percent applies to any distribution For K = 2,
Minimum percent
Likewise, between ±3 standard deviations from the mean there will always be a minimum of 89% of the data. For K = 3,
Minimum percent
The following table lists the minimum percent of data in any distribution and the actual percent of data in the normal distribution between ±1.1, ± 1.5, ± 2.0, and ±2.5 standard deviations from the mean. The minimum percents of data m any distribution were calculated by using Chebyshev’s theorem. The actual percents of data for the normal distribution were calculated by using the area given in the standard normal, or z, table.
| K = 1.1 | K = 1.5 | K = 2 | K = 2.5 | |
| Minimum (for any distribution) | 17.4% | 55.6% | 75% | 84% |
| Normal distribution | 72.9% | 86.6% | 95.4% | 98.8% |
| Given distribution |
The third row of the chart has been left blank for you to fill in the percents when you reach part (e).
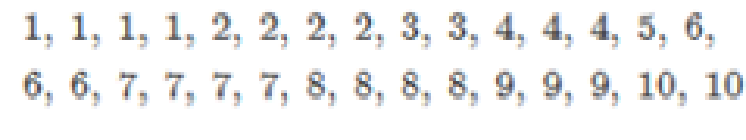
Consider the following 30 pieces of data obtained from a quiz.
- a. Determine the mean of the set of scores.
- b. Determine the standard deviation of the set of scores.
- c. Determine the values that correspond to 1.1, 1.5, 2, and 2.5 standard deviations above the mean. Then determine the values that correspond to 1.1, 1.5, 2, and 2. 5 standard deviations below the mean.
- d. By observing the 30 pieces of data, determine the actual percent of quiz scores between
±1.1 standard deviations from the mean.
±1.5 standard deviations from the mean.
±2 tandard deviations from the mean.
±2.5 standard deviations from the mean.
- e. Place the percents found in part (d) in the third row of the chart.
- f. Compare the percents in the third row of the chart with the minimum percents in the first row and the normal percents in the second row, and then make a judgment as to whether this set of 30 scores is approximately
normally distributed .
Want to see the full answer?
Check out a sample textbook solution
Chapter 12 Solutions
SURVEY OF MATHEMATICS - 24 MONTH MML CO


- Given the following system of equations and its graph below, what can be determined about the slopes and y-intercepts of the system of equations? 7 y 6 5 4 3 2 -6-5-4-3-2-1 1+ -2 1 2 3 4 5 6 x + 2y = 8 2x + 4y = 12 The slopes are different, and the y-intercepts are different. The slopes are different, and the y-intercepts are the same. The slopes are the same, and the y-intercepts are different. O The slopes are the same, and the y-intercepts are the same.arrow_forwardChoose the function to match the graph. -2- 0 -7 -8 -9 --10- |--11- -12- f(x) = log x + 5 f(x) = log x - 5 f(x) = log (x+5) f(x) = log (x-5) 9 10 11 12 13 14arrow_forwardQ2 H let x(+) = &cos (Ait+U) and. 4(+) = ß cos(12t +V), where d. B. 1. In Constants and U,V indep.rus have uniform dist. (-π,π) Show that: ①Rxy (+,4+1)=0 @ Rxy (++) = cos [ when U=V Q3 let x(t) is stochastic process with Wss -121 e, and Rx ltst+1) = ( 2, show that E(X) = E(XS-X₁)² = 2(-1). Qu let x(t) = U Cost + (V+1) Sint, tεIR. where UV indep.rus, and let E (U)-E(V)=0 and E(U) = E(V) = 1, show that Cov (Xt, Xs) = K (t,s) = cos(s-t) X(+) is not WSS.arrow_forward
- Which of the following represents the graph of f(x)=3x-2? 7 6 5 4 ++ + + -7-6-5-4-3-2-1 1 2 3 4 5 6 7 -2 3 -5 6 -7 96 7 5 4 O++ -7-6-5-4-3-2-1 -2 -3 -4 -5 -7 765 432 -7-6-5-4-3-2-1 -2 ++ -3 -4 -5 -6 2 3 4 5 6 7 7 6 2 345 67 -7-6-5-4-3-2-1 2 3 4 5 67 4 -5arrow_forward21. find the mean. and variance of the following: Ⓒ x(t) = Ut +V, and V indepriv. s.t U.VN NL0, 63). X(t) = t² + Ut +V, U and V incepires have N (0,8) Ut ①xt = e UNN (0162) ~ X+ = UCOSTE, UNNL0, 62) SU, Oct ⑤Xt= 7 where U. Vindp.rus +> ½ have NL, 62). ⑥Xn = ΣY, 41, 42, 43, ... Yn vandom sample K=1 Text with mean zen and variance 6arrow_forwardA psychology researcher conducted a Chi-Square Test of Independence to examine whether there is a relationship between college students’ year in school (Freshman, Sophomore, Junior, Senior) and their preferred coping strategy for academic stress (Problem-Focused, Emotion-Focused, Avoidance). The test yielded the following result: image.png Interpret the results of this analysis. In your response, clearly explain: Whether the result is statistically significant and why. What this means about the relationship between year in school and coping strategy. What the researcher should conclude based on these findings.arrow_forward
- A 20 foot ladder rests on level ground; its head (top) is against a vertical wall. The bottom of the ladder begins by being 12 feet from the wall but begins moving away at the rate of 0.1 feet per second. At what rate is the top of the ladder slipping down the wall? You may use a calculator.arrow_forwardA school counselor is conducting a research study to examine whether there is a relationship between the number of times teenagers report vaping per week and their academic performance, measured by GPA. The counselor collects data from a sample of high school students. Write the null and alternative hypotheses for this study. Clearly state your hypotheses in terms of the correlation between vaping frequency and academic performance. EditViewInsertFormatToolsTable 12pt Paragrapharrow_forwardPlease help solve the following whilst showing all working out. Is part of exam revision questions but no solution is givenarrow_forward
 Glencoe Algebra 1, Student Edition, 9780079039897...AlgebraISBN:9780079039897Author:CarterPublisher:McGraw Hill
 Big Ideas Math A Bridge To Success Algebra 1: Stu...AlgebraISBN:9781680331141Author:HOUGHTON MIFFLIN HARCOURTPublisher:Houghton Mifflin Harcourt