
Concept explainers
Videos
(a)
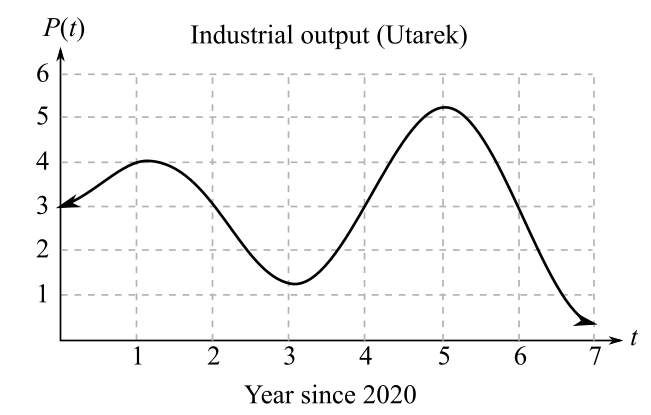
The nearest year in which the rate of change of yearly industrial output reaches a maximum where the graph shows the yearly industrial output (measured in billions of Zonars) of the city-state of Utarek on mars over
(b)
The nearest year in which the rate of change of yearly industrial output reaches a minimum where the graph shows the yearly industrial output (measured in billions of Zonars) of the city-state of Utarek on mars over
(c)
The nearest year in which the graph first change from concave up to concave down and the correct option from the options about the result a) in that year the rate of change of industrial output reached a minimum compared to the nearby years b) in that year the rate of change of industrial output reached a maximum compared to the nearby years; where the graph shows the yearly industrial output (measured in billions of Zonars) of the city-state of Utarek on mars over
Want to see the full answer?
Check out a sample textbook solution
Chapter 12 Solutions
Finite Mathematics and Applied Calculus (MindTap Course List)


 Algebra & Trigonometry with Analytic GeometryAlgebraISBN:9781133382119Author:SwokowskiPublisher:Cengage
 College Algebra (MindTap Course List)AlgebraISBN:9781305652231Author:R. David Gustafson, Jeff HughesPublisher:Cengage Learning
 Mathematics For Machine TechnologyAdvanced MathISBN:9781337798310Author:Peterson, John.Publisher:Cengage Learning,
 Functions and Change: A Modeling Approach to Coll...AlgebraISBN:9781337111348Author:Bruce Crauder, Benny Evans, Alan NoellPublisher:Cengage Learning
 College AlgebraAlgebraISBN:9781305115545Author:James Stewart, Lothar Redlin, Saleem WatsonPublisher:Cengage Learning