
ELEMENTARY STATISTICS W/CONNECT >IP<
4th Edition
ISBN: 9781259746826
Author: Bluman
Publisher: MCG
expand_more
expand_more
format_list_bulleted
Concept explainers
Videos
Textbook Question
Chapter 12.3, Problem 1AC
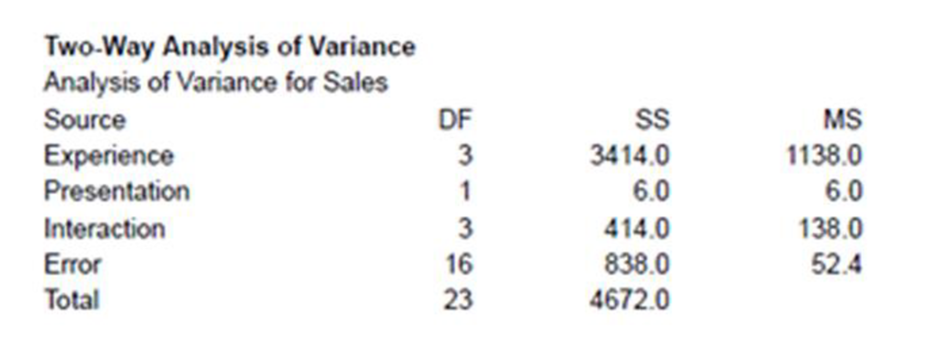
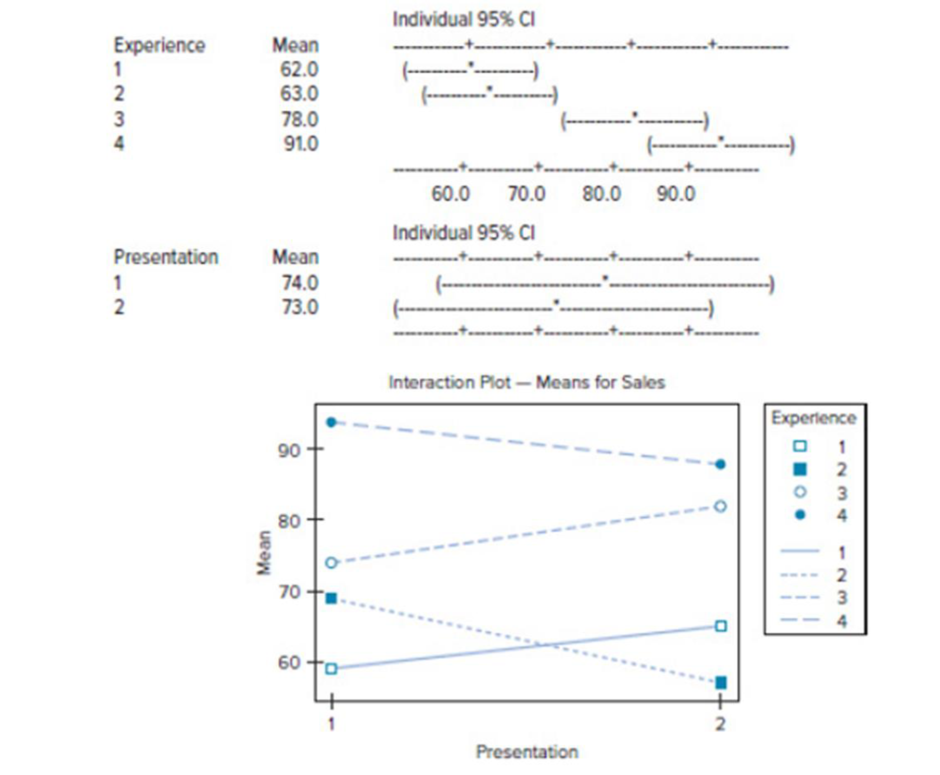
Automobile Sales Techniques
The following outputs are from the result of an analysis of how car sales are affected by the experience of the salesperson and the type of sales technique used. Experience was broken up into four levels, and two different sales techniques were used. Analyze the results and draw conclusions about level of experience with respect to the two different sales techniques and how they affect car sales.
Expert Solution & Answer
Want to see the full answer?
Check out a sample textbook solution
Students have asked these similar questions
if the b coloumn of a z table disappeared what would be used to determine b column probabilities
Construct a model of population flow between metropolitan and nonmetropolitan areas of a given country, given that their respective populations in 2015 were 263 million and 45 million. The probabilities
are given by the following matrix.
(from)
(to)
metro nonmetro
0.99 0.02 metro
0.01 0.98
nonmetro
Predict the population distributions of metropolitan and nonmetropolitan areas for the years 2016 through 2020 (in millions, to four decimal places). (Let x, through x5 represent the years 2016 through
2020, respectively.)
x₁ =
x2
X3
261.27
46.73
11
259.59
48.41
11
257.96
50.04
11
256.39
51.61
11
t
If the average price of a new one family home is $246,300 with a standard deviation of $15,000 find the minimum and maximum prices of the houses that a contractor will build to satisfy 88% of the market value
Chapter 12 Solutions
ELEMENTARY STATISTICS W/CONNECT >IP<
Ch. 12.1 - Colors That Make You Smarter The following set of...Ch. 12.1 - What test is used to compare three or more means?Ch. 12.1 - State three reasons why multiple t tests cannot be...Ch. 12.1 - What are the assumptions for ANOVA?Ch. 12.1 - Define between-group variance and within-group...Ch. 12.1 - State the hypotheses used in the ANOVA test.Ch. 12.1 - When there is no significant difference among...Ch. 12.1 - Prob. 7ECh. 12.1 - For Exercises 7 through 20, assume that all...Ch. 12.1 - For Exercises 7 through 20, assume that all...
Ch. 12.1 - For Exercises 7 through 20, assume that all...Ch. 12.1 - Prob. 11ECh. 12.1 - For Exercises 7 through 20, assume that all...Ch. 12.1 - For Exercises 7 through 20, assume that all...Ch. 12.1 - For Exercises 7 through 20, assume that all...Ch. 12.1 - Prob. 15ECh. 12.1 - For Exercises 7 through 20, assume that all...Ch. 12.1 - For Exercises 7 through 20, assume that all...Ch. 12.1 - For Exercises 7 through 20, assume that all...Ch. 12.1 - For Exercises 7 through 20, assume that all...Ch. 12.1 - For Exercises 7 through 20, assume that all...Ch. 12.2 - Colors That Make You Smarter The following set of...Ch. 12.2 - What two tests can be used to compare two means...Ch. 12.2 - Explain the difference between the two tests used...Ch. 12.2 - For Exercises 3 through 8, the null hypothesis was...Ch. 12.2 - For Exercises 3 through 8, the null hypothesis was...Ch. 12.2 - For Exercises 3 through 8, the null hypothesis was...Ch. 12.2 - For Exercises 3 through 8, the null hypothesis was...Ch. 12.2 - For Exercises 3 through 8, the null hypothesis was...Ch. 12.2 - For Exercises 3 through 8, the null hypothesis was...Ch. 12.2 - For Exercises 9 through 13, do a complete one-way...Ch. 12.2 - Prob. 10ECh. 12.2 - For Exercises 9 through 13, do a complete one-way...Ch. 12.2 - For Exercises 9 through 13, do a complete one-way...Ch. 12.2 - Prob. 13ECh. 12.3 - Automobile Sales Techniques The following outputs...Ch. 12.3 - Prob. 1ECh. 12.3 - Explain what is meant by main effects and...Ch. 12.3 - Prob. 3ECh. 12.3 - How are the F test values computed?Ch. 12.3 - Prob. 5ECh. 12.3 - In a two-way ANOVA, variable A has six levels and...Ch. 12.3 - Prob. 7ECh. 12.3 - When can the main effects for the two-way ANOVA be...Ch. 12.3 - Prob. 9ECh. 12.3 - For Exercises 9 through 15, perform these steps....Ch. 12.3 - For Exercises 9 through 15, perform these steps....Ch. 12.3 - For Exercises 9 through 15, perform these steps....Ch. 12.3 - Prob. 13ECh. 12.3 - For Exercises 9 through 15, perform these steps....Ch. 12.3 - Prob. 15ECh. 12 - If the null hypothesis is rejected in Exercises 1...Ch. 12 - Prob. 12.1.2RECh. 12 - Prob. 12.1.3RECh. 12 - Prob. 12.1.4RECh. 12 - Prob. 12.1.5RECh. 12 - If the null hypothesis is rejected in Exercises 1...Ch. 12 - Prob. 12.1.7RECh. 12 - Prob. 12.1.8RECh. 12 - Review Preparation for Statistics A statistics...Ch. 12 - Effects of Different Types of Diets A medical...Ch. 12 - Prob. 1DACh. 12 - Prob. 2DACh. 12 - Prob. 3DACh. 12 - Prob. 1CQCh. 12 - Prob. 2CQCh. 12 - Prob. 3CQCh. 12 - Determine whether each statement is true or false....Ch. 12 - Prob. 5CQCh. 12 - Prob. 6CQCh. 12 - Prob. 7CQCh. 12 - Prob. 8CQCh. 12 - Complete the following statements with the best...Ch. 12 - Prob. 10CQCh. 12 - For Exercises 11 through 17, use the traditional...Ch. 12 - Prob. 12CQCh. 12 - Prob. 13CQCh. 12 - Prob. 14CQCh. 12 - Prob. 15CQCh. 12 - Prob. 16CQCh. 12 - For Exercises 11 through 17, use the traditional...Ch. 12 - Shown here are the abstract and two tables from a...Ch. 12 - Shown here are the abstract and two tables from a...Ch. 12 - Prob. 3CTCCh. 12 - Prob. 4CTCCh. 12 - Prob. 5CTCCh. 12 - Prob. 6CTCCh. 12 - Prob. 7CTCCh. 12 - Adult Children of Alcoholics Shown here are the...Ch. 12 - Prob. 9CTCCh. 12 - Prob. 10CTCCh. 12 - Prob. 11CTC
Additional Math Textbook Solutions
Find more solutions based on key concepts
For Exercises 13–18, write the negation of the statement.
13. The cell phone is out of juice.
Math in Our World
Provide an example of a qualitative variable and an example of a quantitative variable.
Elementary Statistics ( 3rd International Edition ) Isbn:9781260092561
153. A rain gutter is made from sheets of aluminum that are 20 inches wide. As shown in the figure, the edges ...
College Algebra (7th Edition)
The first derivative of function y=25x4.
Calculus for Business, Economics, Life Sciences, and Social Sciences (14th Edition)
(a) Make a stem-and-leaf plot for these 24 observations on the number of customers who used a down-town CitiBan...
APPLIED STAT.IN BUS.+ECONOMICS
Knowledge Booster


Learn more about
Need a deep-dive on the concept behind this application? Look no further. Learn more about this topic, statistics and related others by exploring similar questions and additional content below.Similar questions
- 21. ANALYSIS OF LAST DIGITS Heights of statistics students were obtained by the author as part of an experiment conducted for class. The last digits of those heights are listed below. Construct a frequency distribution with 10 classes. Based on the distribution, do the heights appear to be reported or actually measured? Does there appear to be a gap in the frequencies and, if so, how might that gap be explained? What do you know about the accuracy of the results? 3 4 555 0 0 0 0 0 0 0 0 0 1 1 23 3 5 5 5 5 5 5 5 5 5 5 5 5 6 6 8 8 8 9arrow_forwardA side view of a recycling bin lid is diagramed below where two panels come together at a right angle. 45 in 24 in Width? — Given this information, how wide is the recycling bin in inches?arrow_forward1 No. 2 3 4 Binomial Prob. X n P Answer 5 6 4 7 8 9 10 12345678 8 3 4 2 2552 10 0.7 0.233 0.3 0.132 7 0.6 0.290 20 0.02 0.053 150 1000 0.15 0.035 8 7 10 0.7 0.383 11 9 3 5 0.3 0.132 12 10 4 7 0.6 0.290 13 Poisson Probability 14 X lambda Answer 18 4 19 20 21 22 23 9 15 16 17 3 1234567829 3 2 0.180 2 1.5 0.251 12 10 0.095 5 3 0.101 7 4 0.060 3 2 0.180 2 1.5 0.251 24 10 12 10 0.095arrow_forward
- step by step on Microssoft on how to put this in excel and the answers please Find binomial probability if: x = 8, n = 10, p = 0.7 x= 3, n=5, p = 0.3 x = 4, n=7, p = 0.6 Quality Control: A factory produces light bulbs with a 2% defect rate. If a random sample of 20 bulbs is tested, what is the probability that exactly 2 bulbs are defective? (hint: p=2% or 0.02; x =2, n=20; use the same logic for the following problems) Marketing Campaign: A marketing company sends out 1,000 promotional emails. The probability of any email being opened is 0.15. What is the probability that exactly 150 emails will be opened? (hint: total emails or n=1000, x =150) Customer Satisfaction: A survey shows that 70% of customers are satisfied with a new product. Out of 10 randomly selected customers, what is the probability that at least 8 are satisfied? (hint: One of the keyword in this question is “at least 8”, it is not “exactly 8”, the correct formula for this should be = 1- (binom.dist(7, 10, 0.7,…arrow_forwardKate, Luke, Mary and Nancy are sharing a cake. The cake had previously been divided into four slices (s1, s2, s3 and s4). What is an example of fair division of the cake S1 S2 S3 S4 Kate $4.00 $6.00 $6.00 $4.00 Luke $5.30 $5.00 $5.25 $5.45 Mary $4.25 $4.50 $3.50 $3.75 Nancy $6.00 $4.00 $4.00 $6.00arrow_forwardFaye cuts the sandwich in two fair shares to her. What is the first half s1arrow_forward
- Question 2. An American option on a stock has payoff given by F = f(St) when it is exercised at time t. We know that the function f is convex. A person claims that because of convexity, it is optimal to exercise at expiration T. Do you agree with them?arrow_forwardQuestion 4. We consider a CRR model with So == 5 and up and down factors u = 1.03 and d = 0.96. We consider the interest rate r = 4% (over one period). Is this a suitable CRR model? (Explain your answer.)arrow_forwardQuestion 3. We want to price a put option with strike price K and expiration T. Two financial advisors estimate the parameters with two different statistical methods: they obtain the same return rate μ, the same volatility σ, but the first advisor has interest r₁ and the second advisor has interest rate r2 (r1>r2). They both use a CRR model with the same number of periods to price the option. Which advisor will get the larger price? (Explain your answer.)arrow_forward
- Question 5. We consider a put option with strike price K and expiration T. This option is priced using a 1-period CRR model. We consider r > 0, and σ > 0 very large. What is the approximate price of the option? In other words, what is the limit of the price of the option as σ∞. (Briefly justify your answer.)arrow_forwardQuestion 6. You collect daily data for the stock of a company Z over the past 4 months (i.e. 80 days) and calculate the log-returns (yk)/(-1. You want to build a CRR model for the evolution of the stock. The expected value and standard deviation of the log-returns are y = 0.06 and Sy 0.1. The money market interest rate is r = 0.04. Determine the risk-neutral probability of the model.arrow_forwardSeveral markets (Japan, Switzerland) introduced negative interest rates on their money market. In this problem, we will consider an annual interest rate r < 0. We consider a stock modeled by an N-period CRR model where each period is 1 year (At = 1) and the up and down factors are u and d. (a) We consider an American put option with strike price K and expiration T. Prove that if <0, the optimal strategy is to wait until expiration T to exercise.arrow_forward
arrow_back_ios
SEE MORE QUESTIONS
arrow_forward_ios
Recommended textbooks for you
 Big Ideas Math A Bridge To Success Algebra 1: Stu...AlgebraISBN:9781680331141Author:HOUGHTON MIFFLIN HARCOURTPublisher:Houghton Mifflin Harcourt
 Glencoe Algebra 1, Student Edition, 9780079039897...AlgebraISBN:9780079039897Author:CarterPublisher:McGraw Hill
 Holt Mcdougal Larson Pre-algebra: Student Edition...AlgebraISBN:9780547587776Author:HOLT MCDOUGALPublisher:HOLT MCDOUGAL
 Functions and Change: A Modeling Approach to Coll...AlgebraISBN:9781337111348Author:Bruce Crauder, Benny Evans, Alan NoellPublisher:Cengage Learning
 Linear Algebra: A Modern IntroductionAlgebraISBN:9781285463247Author:David PoolePublisher:Cengage Learning
Big Ideas Math A Bridge To Success Algebra 1: Stu...
Algebra
ISBN:9781680331141
Author:HOUGHTON MIFFLIN HARCOURT
Publisher:Houghton Mifflin Harcourt
Glencoe Algebra 1, Student Edition, 9780079039897...
Algebra
ISBN:9780079039897
Author:Carter
Publisher:McGraw Hill
Holt Mcdougal Larson Pre-algebra: Student Edition...
Algebra
ISBN:9780547587776
Author:HOLT MCDOUGAL
Publisher:HOLT MCDOUGAL
Functions and Change: A Modeling Approach to Coll...
Algebra
ISBN:9781337111348
Author:Bruce Crauder, Benny Evans, Alan Noell
Publisher:Cengage Learning
Linear Algebra: A Modern Introduction
Algebra
ISBN:9781285463247
Author:David Poole
Publisher:Cengage Learning
Correlation Vs Regression: Difference Between them with definition & Comparison Chart; Author: Key Differences;https://www.youtube.com/watch?v=Ou2QGSJVd0U;License: Standard YouTube License, CC-BY
Correlation and Regression: Concepts with Illustrative examples; Author: LEARN & APPLY : Lean and Six Sigma;https://www.youtube.com/watch?v=xTpHD5WLuoA;License: Standard YouTube License, CC-BY