
Organic Chemistry Plus Masteringchemistry With Pearson Etext, Global Edition
9th Edition
ISBN: 9781292151229
Author: Wade, LeRoy G.
Publisher: PEARSON
expand_more
expand_more
format_list_bulleted
Concept explainers
Videos
Textbook Question
Chapter 12.15A, Problem 12.9P
Show the fragmentations that give rise to the peaks at m/z 43, 57, and 85 in the mass spectrum of 2,4-dimethylpentane (Figure12-17).
| m/z | Abundance (% of base Peak) |
| 41 | 34 |
| 42 | 24 |
| 43(base peak) | 100 |
| 56 | 35 |
| 57 | 72 |
| 85 | 19 |
| 100 (M+) |
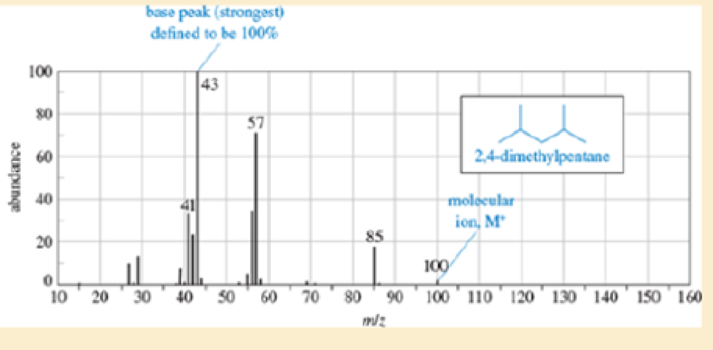
Figure 12-17
Expert Solution & Answer
Want to see the full answer?
Check out a sample textbook solution
Students have asked these similar questions
Obtain 2-methylbutanoic acid by malonic or acetylacetic synthesis (indicate the formulas of the compounds involved).
EFFICIENTS
SAMPLE READINGS
CONCENTRATIONS
Pigiadient)
TOMATO SAUCE (REGULAR)
TOMATO (REDUCED SALT)
TOMATO SAUCE (REGULAR)
TOMATO (REDUCED SALT)
58
6.274
3.898
301.7
151.2
14150
5.277
3.865
348.9
254.8
B
5.136
3.639
193.7
85.9
605
4.655
3.041
308.6
199.6
05
5.135
3.664
339.5
241.4
0139
4.676
3.662
160.6
87.6
90148
5.086
3.677
337.7
242.5
0092
6.348
3.775
464.7
186.4
PART3
5.081
3.908
223.5
155.8
5.558
3.861
370.5
257.1
4.922
3.66
326.6
242.9
4.752
3.641
327.5
253.3
50
5.018
3.815
336.1
256.0
84
4.959
3.605
317.9
216.6
38
4.96
3.652
203.8
108.7
$3
5.052
3.664
329.8
239.0
17
5.043
3.767
221.9
149.7
052
5.058
3.614
331.7
236.4
5.051
4.005
211.7
152.1
62
5.047
3.637
309.6
222.7
5.298
3.977
223.4
148.7
5.38
4.24
353.7
278.2
5
5.033
4.044
334.6
268.7
995
4.706
3.621
305.6
234.4
04
4.816
3.728
340.0
262.7
16
4.828
4.496
304.3
283.2
0.011
4.993
3.865
244.7
143.6
AVERAGE
STDEV
COUNT
95% CI Confidence Interval (mmol/L)
[Na+] (mg/100 mL)
95% Na+ Confidence Interval (mg/100 mL)
If we have two compounds: acetone (CH₃COCH₃) and acetic acid (CH₃COOH), applying heat to them produces an aldol condensation of the two compounds. If this is correct, draw the formula for the final product.
Chapter 12 Solutions
Organic Chemistry Plus Masteringchemistry With Pearson Etext, Global Edition
Ch. 12.3 - Complete the following conversion table. (cm1)...Ch. 12.5 - Which of the bonds shown in red are expected to...Ch. 12.7C - For each hydrocarbon spectrum, determine whether...Ch. 12.9A - Spectra are given for three compounds. Each...Ch. 12.10 - The infrared spectra for three compounds are...Ch. 12.12 - Prob. 12.6PCh. 12.14B - Identify which of these four mass spectra indicate...Ch. 12.15A - Show the fragmentation that accounts for the...Ch. 12.15A - Show the fragmentations that give rise to the...Ch. 12.15B - Ethers are not easily differentiated by their...
Ch. 12.15C - Prob. 12.11PCh. 12 - Prob. 12.12SPCh. 12 - Prob. 12.13SPCh. 12 - All of the following compounds absorb infrared...Ch. 12 - Prob. 12.15SPCh. 12 - Four infrared spectra are shown, corresponding to...Ch. 12 - Predict the masses and the structures of the most...Ch. 12 - Prob. 12.18SPCh. 12 - Prob. 12.19SPCh. 12 - (A true story) While organizing the undergraduate...Ch. 12 - Prob. 12.21SPCh. 12 - Prob. 12.22SPCh. 12 - An unknown, foul-smelling hydrocarbon gives the...Ch. 12 - covered a synthesis of alkynes by a double...Ch. 12 - Three IR spectra are shown, corresponding to three...Ch. 12 - Prob. 12.26SPCh. 12 - Prob. 12.27SPCh. 12 - Prob. 12.28SPCh. 12 - The ultimate test of fluency in MS and IR is...Ch. 12 - Prob. 12.30SPCh. 12 - Consider the following four structures, followed...
Knowledge Booster


Learn more about
Need a deep-dive on the concept behind this application? Look no further. Learn more about this topic, chemistry and related others by exploring similar questions and additional content below.Similar questions
- If we have two compounds: acetone (CH3COCH3) and acetic acid (CH3COOH); if we apply heat (A), what product(s) are obtained?arrow_forwardQUESTION: Fill out the answers to the empty green boxes attached in the image. *Ensure you all incorporate all 27 values (per column)*arrow_forwardYou need to make a buffer by dissolving benzoic acid and sodium benzoate in water. What is the mass of benzoic acid that you would weigh out, in mg, to create 50 mL of a buffer at pH = 4.7 that will change pH no more than 0.10 units with the addition of 0.001 moles of acid or base? Enter just the answer without the units (mg) - just the number will do!arrow_forward
- Give the organic product: O A O B Ос ○ D -NH–CH3 + CH3 CH3 NEN C ? A CH3 CH3 NH- CH3 B CH3 CH3 N=N- C CH3 CH3 N=NNH CH3 D CH3 N=N CH3 NHCH3 LNH CHOarrow_forwardFinish the reaction- hand written pleasearrow_forwardGive the organic products: (benzyne) Br ? CH3 + K* :NH, liq NH3 HINT: Two products are formed. Each is a substituted aniline; they are isomers of each other. NH2 II I H₂N. CH3 CH3 III Select one: ○ A. I and II ○ B. I and III O C. I and IV O D. II and III O E. III and IV H₂N CH3 IV CH₂-NH2arrow_forward
- Predict the major products of this organic reaction: HBr (1 equiv) cold ? Some important notes: • Draw the major product, or products, of this reaction in the drawing area below. • You can draw the products in any arrangement you like. • Pay careful attention to the reaction conditions, and only include the major products. • Be sure to use wedge and dash bonds when necessary, for example to distinguish between major products that are enantiomers. • Note that there is only 1 equivalent of HBr reactant, so you need not consider the case of multiple additions. Erase something Explanation Check 2025 McGraw Hill LLC. All Rights Reserved. Terarrow_forwardQ14. Fill this chart: (please refer to ppt notes/browser to answer these questions) What alcohol is also called wood alcohol? What is the common name of ethanol? Draw the structure of phenol and thiophene? Are bigger chain alcohol like heptanol and octanol are soluble or insoluble in water and explain it ? Are ethers soluble or insoluble in water? What suffix and prefix are used for alcohol while naming alcohol and ether? What the process called when we add water to any alkene to make alcohol? Q16. Draw the diagram of following aromatic compound (practice from previous module) Aniline Phenol Benzoic acid Methyl benzoate Q17. a. Write the oxidation reactions for the 2 propanol. b. Write the oxidation reaction of the ethanol.arrow_forwardQuestion 11 of 18 (1 point) Question Attempt: 3 of How many signals do you expect in the 'H NMR spectrum for this molecule? Br Br Write the answer below. Also, in each of the drawing areas below is a copy of the molecule, with Hs shown. In each copy, one of the H atoms is colored red. Highlight in red all other H atoms that would contribute to the same signal as the H already highlighted red. Note for advanced students: In this question, any multiplet is counted as one signal. Number of signals in the 'H NMR spectrum. 1 For the molecule in the top drawing area, highlight in red any other H atoms that will contribute to the same signal as the H atom already highlighted red. If no other H atoms will contribute, check the box at right. No additional Hs to color in top molecule Check For the molecule in the bottom drawing area, highlight in red any other H atoms that will contribute to the same signal as the H atom already highlighted red. If no other H atoms will contribute, check the box…arrow_forward
arrow_back_ios
SEE MORE QUESTIONS
arrow_forward_ios
Recommended textbooks for you
 Principles of Instrumental AnalysisChemistryISBN:9781305577213Author:Douglas A. Skoog, F. James Holler, Stanley R. CrouchPublisher:Cengage Learning
Principles of Instrumental Analysis
Chemistry
ISBN:9781305577213
Author:Douglas A. Skoog, F. James Holler, Stanley R. Crouch
Publisher:Cengage Learning
Mass Spectrometry; Author: Professor Dave Explains;https://www.youtube.com/watch?v=hSirWciIvSg;License: Standard YouTube License, CC-BY