
Concept explainers
Videos
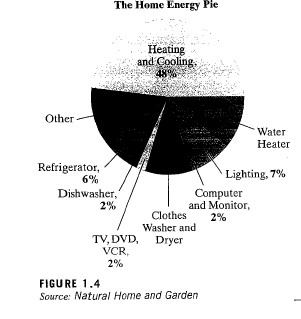
Source Natural Home and Garden
CHECK POINT 5 Being aware of which appliances and activities inyour home use the most energy can help you make sound decisions thatallow you to decrease energy consumption and increase savings. Thecircle graph in Figure 1.4 shows how energy consumption is distributedthroughout a typical home.
Suppose that last year your family spent $2148.72 on natural gas andelectricity. Assuming the circle graph in Figure 1.4 is representative ofyour family’s energy consumption.
a. Use the appropriate information displayed by the graph todetermine a calculation that shows the amount your family spenton heating and cooling for the year.
b. Use rounding to find a reasonable estimate for this calculation.
Want to see the full answer?
Check out a sample textbook solution
Chapter 1 Solutions
MYMATHLAB F/THINKING MATHEMATICALLY>CU


- Let f:R->R be defined by f(x)=x^(3)+5.(a) Determine if f is injective. why?(b) Determine if f is surjective. why?(c) Based upon (a) and (b), is f bijective? why?arrow_forwardLet f:R->R be defined by f(x)=x^(3)+5.(a) Determine if f is injective.(b) Determine if f is surjective. (c) Based upon (a) and (b), is f bijective?arrow_forwardPlease as many detarrow_forward
- 8–23. Sketching vector fields Sketch the following vector fieldsarrow_forward25-30. Normal and tangential components For the vector field F and curve C, complete the following: a. Determine the points (if any) along the curve C at which the vector field F is tangent to C. b. Determine the points (if any) along the curve C at which the vector field F is normal to C. c. Sketch C and a few representative vectors of F on C. 25. F = (2½³, 0); c = {(x, y); y − x² = 1} 26. F = x (23 - 212) ; C = {(x, y); y = x² = 1}) , 2 27. F(x, y); C = {(x, y): x² + y² = 4} 28. F = (y, x); C = {(x, y): x² + y² = 1} 29. F = (x, y); C = 30. F = (y, x); C = {(x, y): x = 1} {(x, y): x² + y² = 1}arrow_forward٣/١ B msl kd 180 Ka, Sin (1) I sin () sin(30) Sin (30) اذا ميريد شرح الكتب بس 0 بالفراغ 3) Cos (30) 0.866 4) Rotating 5) Synchronous speed, 120 x 50 G 5005 1000 s = 1000-950 Copper bosses 5kW Rotor input 5 0.05 : loo kw 6) 1 /0001 ined sove in peaper I need a detailed solution on paper please وه اذا ميريد شرح الكتب فقط ١٥٠ DC 7) rotor a ' (y+xlny + xe*)dx + (xsiny + xlnx + dy = 0. Q1// Find the solution of: ( 357arrow_forward
- ۳/۱ R₂ = X2 2) slots per pole per phase 3/31 B. 180 msl Kas Sin (I) 1sin() sin(30) Sin (30) اذا ميريد شرح الكتب بس 0 بالفراغ 3) Cos (30): 0.866 4) Rotating 5) Synchronous speeds 120×50 looo G 1000-950 1000 Copper losses 5kw Rotor input 5 loo kw 0.05 6) 1 اذا ميريد شرح الكتب فقط look 7) rotor DC ined sove in peaper I need a detailed solution on paper please 0 64 Find the general solution of the following equations: QI//y(4)-16y= 0. Find the general solution of the following equations: Q2ll yll-4y/ +13y=esinx.arrow_forwardR₂ = X2 2) slots per pole per phase = 3/31 B-180 60 msl kd Kas Sin () 2 I sin (6) sin(30) Sin (30) اذا مريد شرح الكتب بس 0 بالفراغ 3 Cos (30) 0.866 4) Rotating ined sove in peaper 5) Synchronous speed s 120×50 6 s = 1000-950 1000 Copper losses 5kw Rotor input 5 0.05 6) 1 loo kw اذا ميريد شرح الكتب فقط Look 7) rotov DC I need a detailed solution on paper please 0 64 Solve the following equations: 0 Q1// Find the solution of: ( y • with y(0) = 1. dx x²+y²arrow_forwardR₂ = X2 2) slots per pole per phase = 3/3 1 B-180-60 msl Ka Sin (1) Isin () sin(30) Sin (30) اذا ميريد شرح الكتب بس 0 بالفراغ 3) Cos (30) 0.866 4) Rotating 5) Synchronous speed, 120 x 50 s = 1000-950 1000 Copper losses 5kw Rotor input 5 6) 1 0.05 G 50105 loo kw اذا ميريد شرح الكتب فقط look 7) rotov DC ined sove in peaper I need a detailed solution on paper please 064 2- A hot ball (D=15 cm ) is cooled by forced air T.-30°C, the rate of heat transfer from the ball is 460.86 W. Take for the air -0.025 Wim °C and Nu=144.89, find the ball surface temperature a) 300 °C 16 b) 327 °C c) 376 °C d) None か = 750 01arrow_forward
- Answer questions 8.3.3 and 8.3.4 respectively 8.3.4 .WP An article in Medicine and Science in Sports and Exercise [“Electrostimulation Training Effects on the Physical Performance of Ice Hockey Players” (2005, Vol. 37, pp. 455–460)] considered the use of electromyostimulation (EMS) as a method to train healthy skeletal muscle. EMS sessions consisted of 30 contractions (4-second duration, 85 Hz) and were carried out three times per week for 3 weeks on 17 ice hockey players. The 10-meter skating performance test showed a standard deviation of 0.09 seconds. Construct a 95% confidence interval of the standard deviation of the skating performance test.arrow_forward8.6.7 Consider the tire-testing data in Exercise 8.2.3. Compute a 95% tolerance interval on the life of the tires that has confidence level 95%. Compare the length of the tolerance interval with the length of the 95% CI on the population mean. Which interval is shorter? Discuss the difference in interpretation of these two intervals.arrow_forward8.6.2 Consider the natural frequency of beams described in Exercise 8.2.8. Compute a 90% prediction interval on the diameter of the natural frequency of the next beam of this type that will be tested. Compare the length of the prediction interval with the length of the 90% CI on the population mean. 8.6.3 Consider the television tube brightness test described in Exercise 8.2.7. Compute a 99% prediction interval on the brightness of the next tube tested. Compare the length of the prediction interval with the length of the 99% CI on the population mean.arrow_forward
 Algebra & Trigonometry with Analytic GeometryAlgebraISBN:9781133382119Author:SwokowskiPublisher:Cengage
 College Algebra (MindTap Course List)AlgebraISBN:9781305652231Author:R. David Gustafson, Jeff HughesPublisher:Cengage Learning
 Glencoe Algebra 1, Student Edition, 9780079039897...AlgebraISBN:9780079039897Author:CarterPublisher:McGraw Hill
 Trigonometry (MindTap Course List)TrigonometryISBN:9781305652224Author:Charles P. McKeague, Mark D. TurnerPublisher:Cengage Learning
 Big Ideas Math A Bridge To Success Algebra 1: Stu...AlgebraISBN:9781680331141Author:HOUGHTON MIFFLIN HARCOURTPublisher:Houghton Mifflin Harcourt
 Algebra: Structure And Method, Book 1AlgebraISBN:9780395977224Author:Richard G. Brown, Mary P. Dolciani, Robert H. Sorgenfrey, William L. ColePublisher:McDougal Littell