
Concept explainers
Videos
In 2011, the industries with the most complaints to the Better Business Bureau were banks, cable and satellite television companies, collection agencies, cellular phone providers, and new car dealerships (USA Today, April 16, 2012). The results for a sample of 200 complaints are contained in the DATAfile named BBB.
- a. Construct a frequency distribution for the number of complaints by industry.
- b. Using α = .01, conduct a hypothesis test to determine whether the
probability of a complaint is the same for the five industries. What is your conclusion? - c. Drop the industry with the most complaints. Using α = .05, conduct a hypothesis test to determine whether the probability of a complaint is the same for the remaining four industries.
a.
Construct a frequency distribution for the number of complaints by industry.
Answer to Problem 25SE
The frequency distribution for the number of complaints by industry is tabulated as follows:
| Category | Observed Frequency |
| Bank | 26 |
| Cable | 44 |
| Car | 42 |
| Cell | 60 |
| Collection | 28 |
Explanation of Solution
Calculation:
The given data show the results for a sample of 200 complaints.
From the given data, it can be observed that the number of categories is 4. The frequencies for bank, cable, car, cell, and collection are 26, 44, 42, 60, and 28, respectively.
Therefore, the frequency distribution for the number of complaints by industry is tabulated as follows:
| Category | Observed Frequency |
| Bank | 26 |
| Cable | 44 |
| Car | 42 |
| Cell | 60 |
| Collection | 28 |
b.
Perform a hypothesis test at 0.01 level of significance.
Draw conclusion.
Answer to Problem 25SE
The conclusion is that the probability of a complaint is not the same for the five industries.
Explanation of Solution
Calculation:
State the test hypotheses:
Null hypothesis:
That is, all population proportions are equal for five museums.
Alternative hypothesis:
That is, not all population proportions are equal for five industries.
The formula for chi-square test statistic is as follows:
Here,
In this case, it is observed that the probability of a complaint is the same for each of the five industries. That is, 0.2
The expected frequency is obtained as follows:
The value of
| Observed Frequency | Expected Frequency | ||
| 26 | 40 | –14 | 4.9 |
| 44 | 40 | 4 | 0.4 |
| 42 | 40 | 2 | 0.1 |
| 60 | 40 | 20 | 10 |
| 28 | 40 | –12 | 3.6 |
| Total |
Thus, the value of
Degrees of freedom:
The degrees of freedom is
Thus, the degree of freedom is 4.
Level of significance:
The given level of significance is
p-value:
Software procedure:
Step-by-step software procedure to obtain p-value using EXCEL:
- Open an EXCEL sheet and select cell A1.
- In cell A1, enter the formula =CHISQ.DIST.RT(19,4).
- Press Enter.
The output obtained using EXCEL is given below:
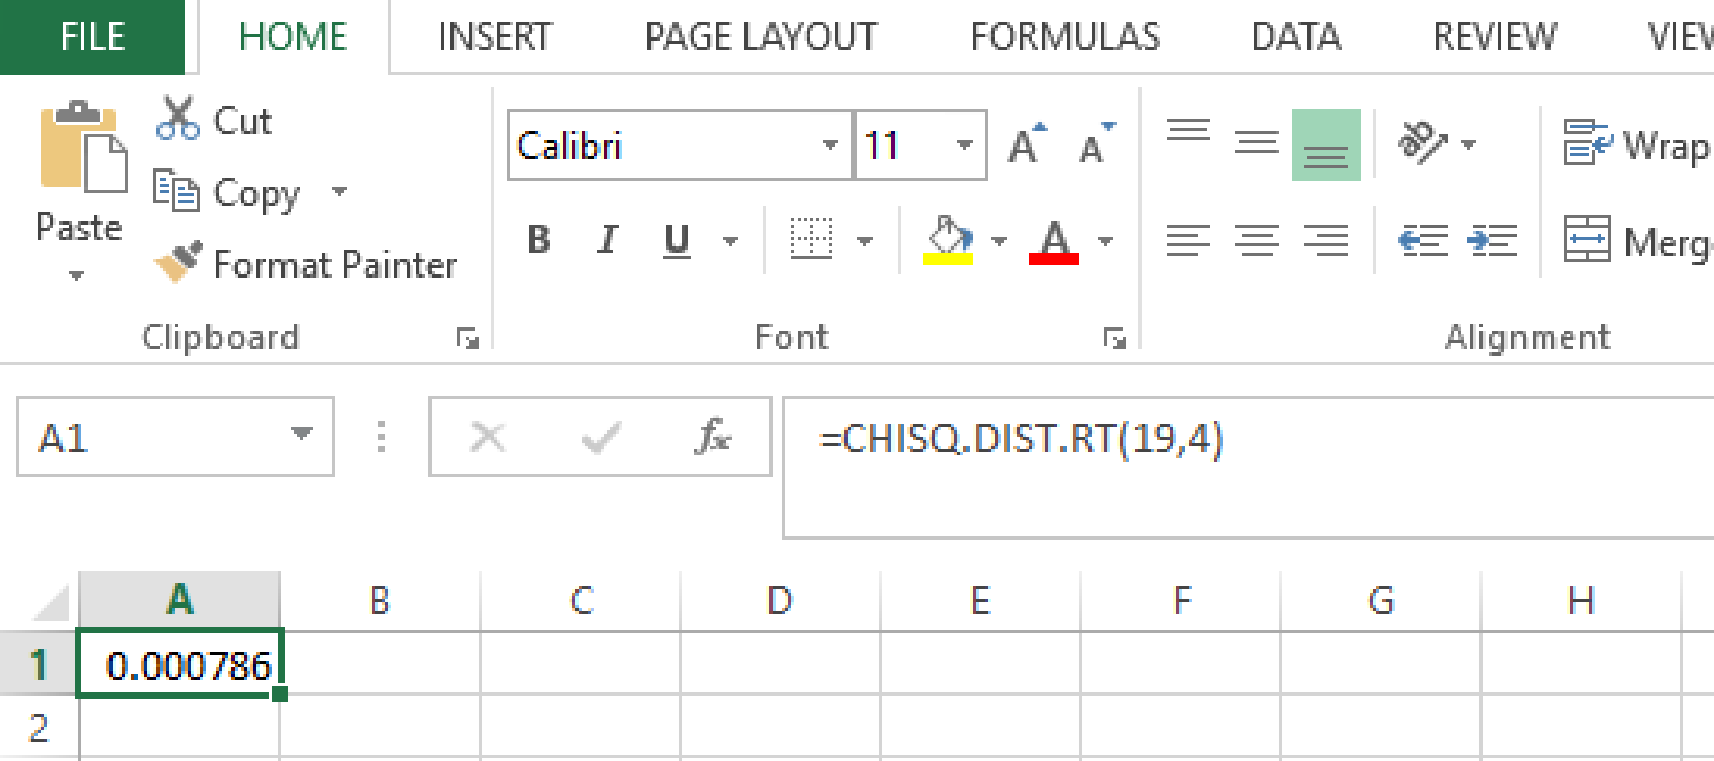
From the output, the p-value is 0.0008.
Rejection rule:
- If the
- Otherwise, do not reject the null hypothesis.
Conclusion:
Here, the p-value is less than the level of significance.
That is,
Thus, the decision is “reject the null hypothesis”.
Therefore, there is sufficient evidence to conclude that the probability of a complaint is not the same for the five industries.
c.
Drop the industry with the most complaints and perform a hypothesis test at 0.05 level of significance.
Answer to Problem 25SE
The conclusion is that the probability of a complaint is the same for the remaining four industries.
Explanation of Solution
Calculation:
From Part (a), it can be observed that the category cell has more complaints. Therefore, drop the category cell.
State the test hypotheses:
Null hypothesis:
That is, all population proportions are equal for five museums.
Alternative hypothesis:
That is, not all population proportions are equal for the remaining four industries.
The formula for chi-square test statistic is as follows:
Here,
In this case, it is observed that the probability of a complaint is the same for each of the four industries. That is, 0.25
The expected frequency is obtained as follows:
The value of
| Observed Frequency | Expected Frequency | ||
| 26 | 35 | –9 | 2.31 |
| 44 | 35 | 9 | 2.31 |
| 42 | 35 | 7 | 1.4 |
| 28 | 35 | –7 | 1.4 |
| Total |
Thus, the value of
Degrees of freedom:
The degrees of freedom is
Thus, the degree of freedom is 3.
Level of significance:
The given level of significance is
p-value:
Software procedure:
Step-by-step software procedure to obtain p-value using EXCEL:
- Open an EXCEL sheet and select cell A1.
- In cell A1, enter the formula =CHISQ.DIST.RT(7.42,3).
- Press Enter.
The output using EXCEL is given below:
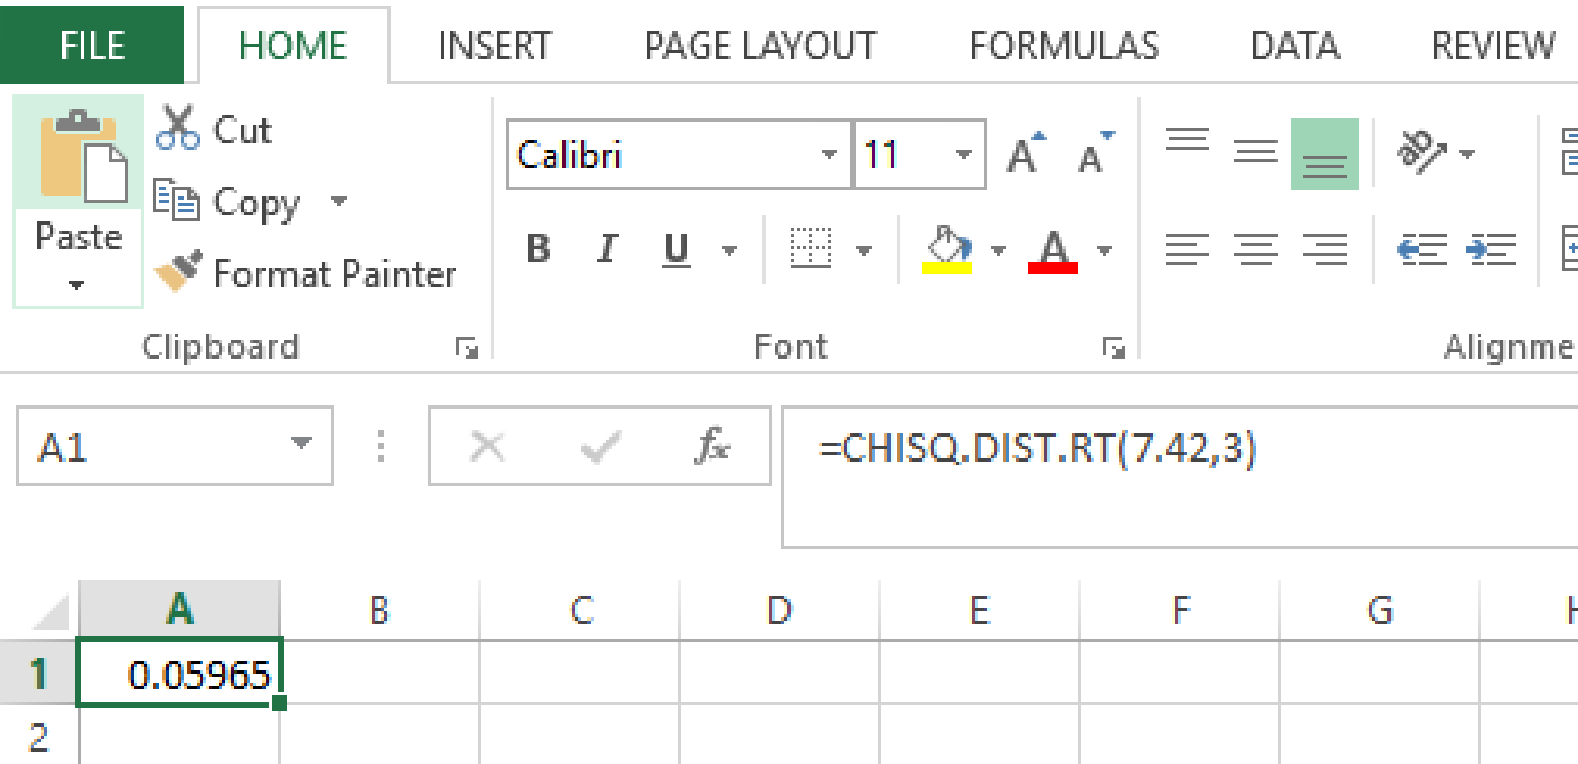
From the output, the p-value is 0.0596.
Rejection rule:
- If the
- Otherwise, do not reject the null hypothesis.
Conclusion:
Here, the p-value is less than the level of significance.
That is,
Thus, the decision is “reject the null hypothesis”.
Therefore, there is no sufficient evidence to conclude that the probability of a complaint is not the same for the remaining four industries.
Therefore, the conclusion is that the probability of a complaint is the same for the remaining four industries.
Want to see more full solutions like this?
Chapter 12 Solutions
Modern Business Statistics with Microsoft Excel (MindTap Course List)


- I need help with this problem and an explanation of the solution for the image described below. (Statistics: Engineering Probabilities)arrow_forward310015 K Question 9, 5.2.28-T Part 1 of 4 HW Score: 85.96%, 49 of 57 points Points: 1 Save of 6 Based on a poll, among adults who regret getting tattoos, 28% say that they were too young when they got their tattoos. Assume that six adults who regret getting tattoos are randomly selected, and find the indicated probability. Complete parts (a) through (d) below. a. Find the probability that none of the selected adults say that they were too young to get tattoos. 0.0520 (Round to four decimal places as needed.) Clear all Final check Feb 7 12:47 US Oarrow_forwardhow could the bar graph have been organized differently to make it easier to compare opinion changes within political partiesarrow_forward
- 30. An individual who has automobile insurance from a certain company is randomly selected. Let Y be the num- ber of moving violations for which the individual was cited during the last 3 years. The pmf of Y isy | 1 2 4 8 16p(y) | .05 .10 .35 .40 .10 a.Compute E(Y).b. Suppose an individual with Y violations incurs a surcharge of $100Y^2. Calculate the expected amount of the surcharge.arrow_forward24. An insurance company offers its policyholders a num- ber of different premium payment options. For a ran- domly selected policyholder, let X = the number of months between successive payments. The cdf of X is as follows: F(x)=0.00 : x < 10.30 : 1≤x<30.40 : 3≤ x < 40.45 : 4≤ x <60.60 : 6≤ x < 121.00 : 12≤ x a. What is the pmf of X?b. Using just the cdf, compute P(3≤ X ≤6) and P(4≤ X).arrow_forward59. At a certain gas station, 40% of the customers use regular gas (A1), 35% use plus gas (A2), and 25% use premium (A3). Of those customers using regular gas, only 30% fill their tanks (event B). Of those customers using plus, 60% fill their tanks, whereas of those using premium, 50% fill their tanks.a. What is the probability that the next customer will request plus gas and fill the tank (A2 B)?b. What is the probability that the next customer fills the tank?c. If the next customer fills the tank, what is the probability that regular gas is requested? Plus? Premium?arrow_forward
- 38. Possible values of X, the number of components in a system submitted for repair that must be replaced, are 1, 2, 3, and 4 with corresponding probabilities .15, .35, .35, and .15, respectively. a. Calculate E(X) and then E(5 - X).b. Would the repair facility be better off charging a flat fee of $75 or else the amount $[150/(5 - X)]? [Note: It is not generally true that E(c/Y) = c/E(Y).]arrow_forward74. The proportions of blood phenotypes in the U.S. popula- tion are as follows:A B AB O .40 .11 .04 .45 Assuming that the phenotypes of two randomly selected individuals are independent of one another, what is the probability that both phenotypes are O? What is the probability that the phenotypes of two randomly selected individuals match?arrow_forward53. A certain shop repairs both audio and video compo- nents. Let A denote the event that the next component brought in for repair is an audio component, and let B be the event that the next component is a compact disc player (so the event B is contained in A). Suppose that P(A) = .6 and P(B) = .05. What is P(BA)?arrow_forward
 Glencoe Algebra 1, Student Edition, 9780079039897...AlgebraISBN:9780079039897Author:CarterPublisher:McGraw Hill
 College Algebra (MindTap Course List)AlgebraISBN:9781305652231Author:R. David Gustafson, Jeff HughesPublisher:Cengage Learning
 Holt Mcdougal Larson Pre-algebra: Student Edition...AlgebraISBN:9780547587776Author:HOLT MCDOUGALPublisher:HOLT MCDOUGAL
 Big Ideas Math A Bridge To Success Algebra 1: Stu...AlgebraISBN:9781680331141Author:HOUGHTON MIFFLIN HARCOURTPublisher:Houghton Mifflin Harcourt