
Draw the shear and bending moment diagrams for the girders of given frame.
Explanation of Solution
Given information:
The uniformly distributed load acting along the girder DEF (w) is 30 kN/m.
The horizontal distance of the point AB and BC
The vertical distance of the members AD, BE, and CF
Calculation:
The span length and loads for the two girders of the frame DE and EF are same; therefore the approximate shear and bending moment diagrams for the girders will also be the same.
Consider the girder DE.
Determine the span for the middle portion of the girder using the relation.
Substitute 6 m for L.
Determine the span for the two end portion of the girder using the relation.
Substitute 6 m for L.
Draw the statically determinate girder portion as in Figure (1).
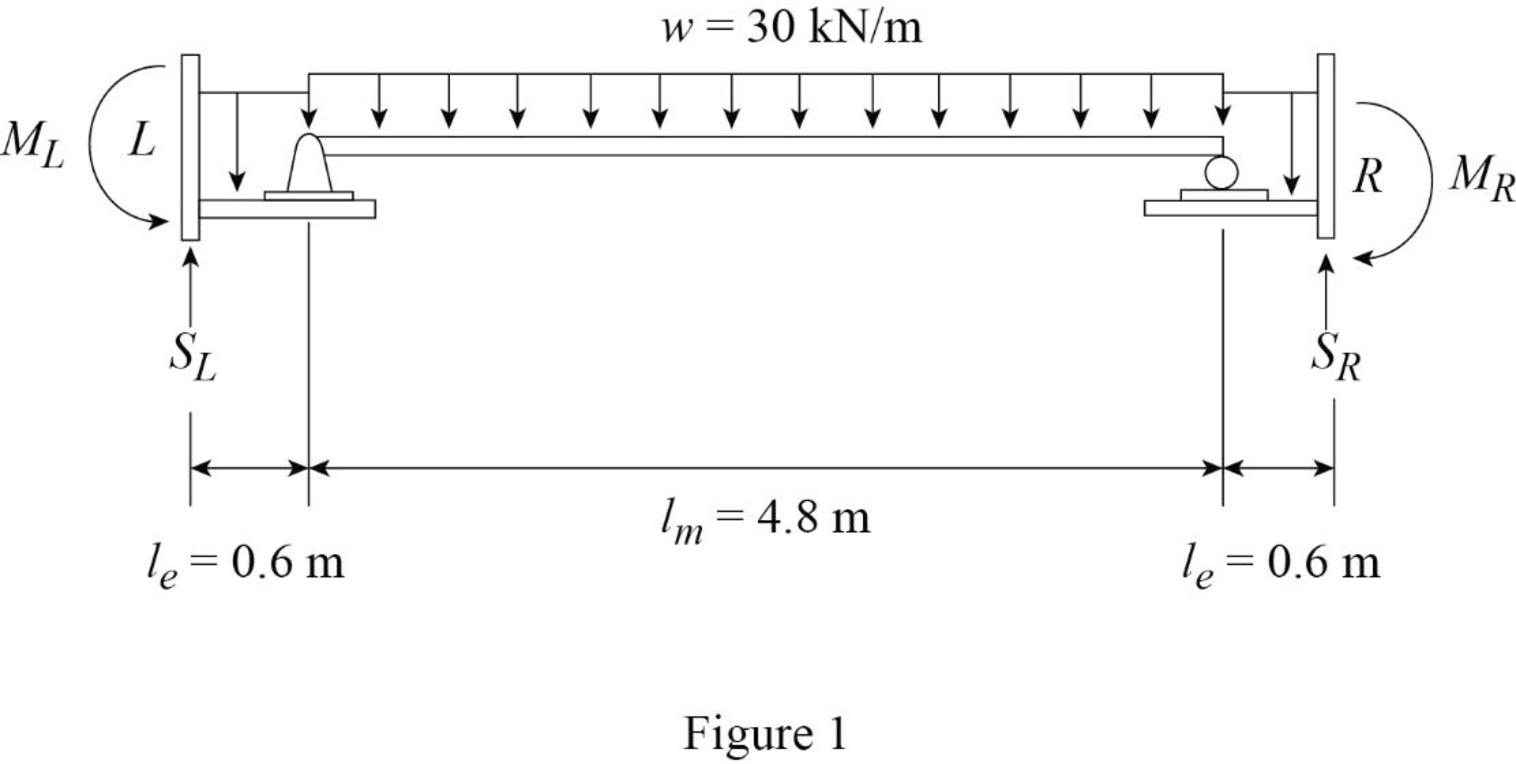
Consider the equilibrium of the simply supported middle portion of the girder.
Determine the vertical reactions at the end portion using the relation.
Substitute 30 kN/m for w and 4.8 m for
Consider the equilibrium conditions of the end portions of the girder.
Consider upward direction is positive and counter clockwise moment is positive.
Determine the support reaction at the left end.
Apply the equations of equilibrium to the left end portion.
Substitute 30 kN/m for w, 0.6 m for
Determine the moment at the left end.
Take moment about left end is equal to zero.
Substitute 30 kN/m for w, 0.6 m for
Consider upward direction is positive and clockwise moment is positive.
Determine the support reaction at the right end.
Apply the equations of equilibrium to the right end portion.
Substitute 30 kN/m for w, 0.6 m for
Determine the moment at the right end.
Take moment about right end is equal to zero.
Substitute 30 kN/m for w, 0.6 m for
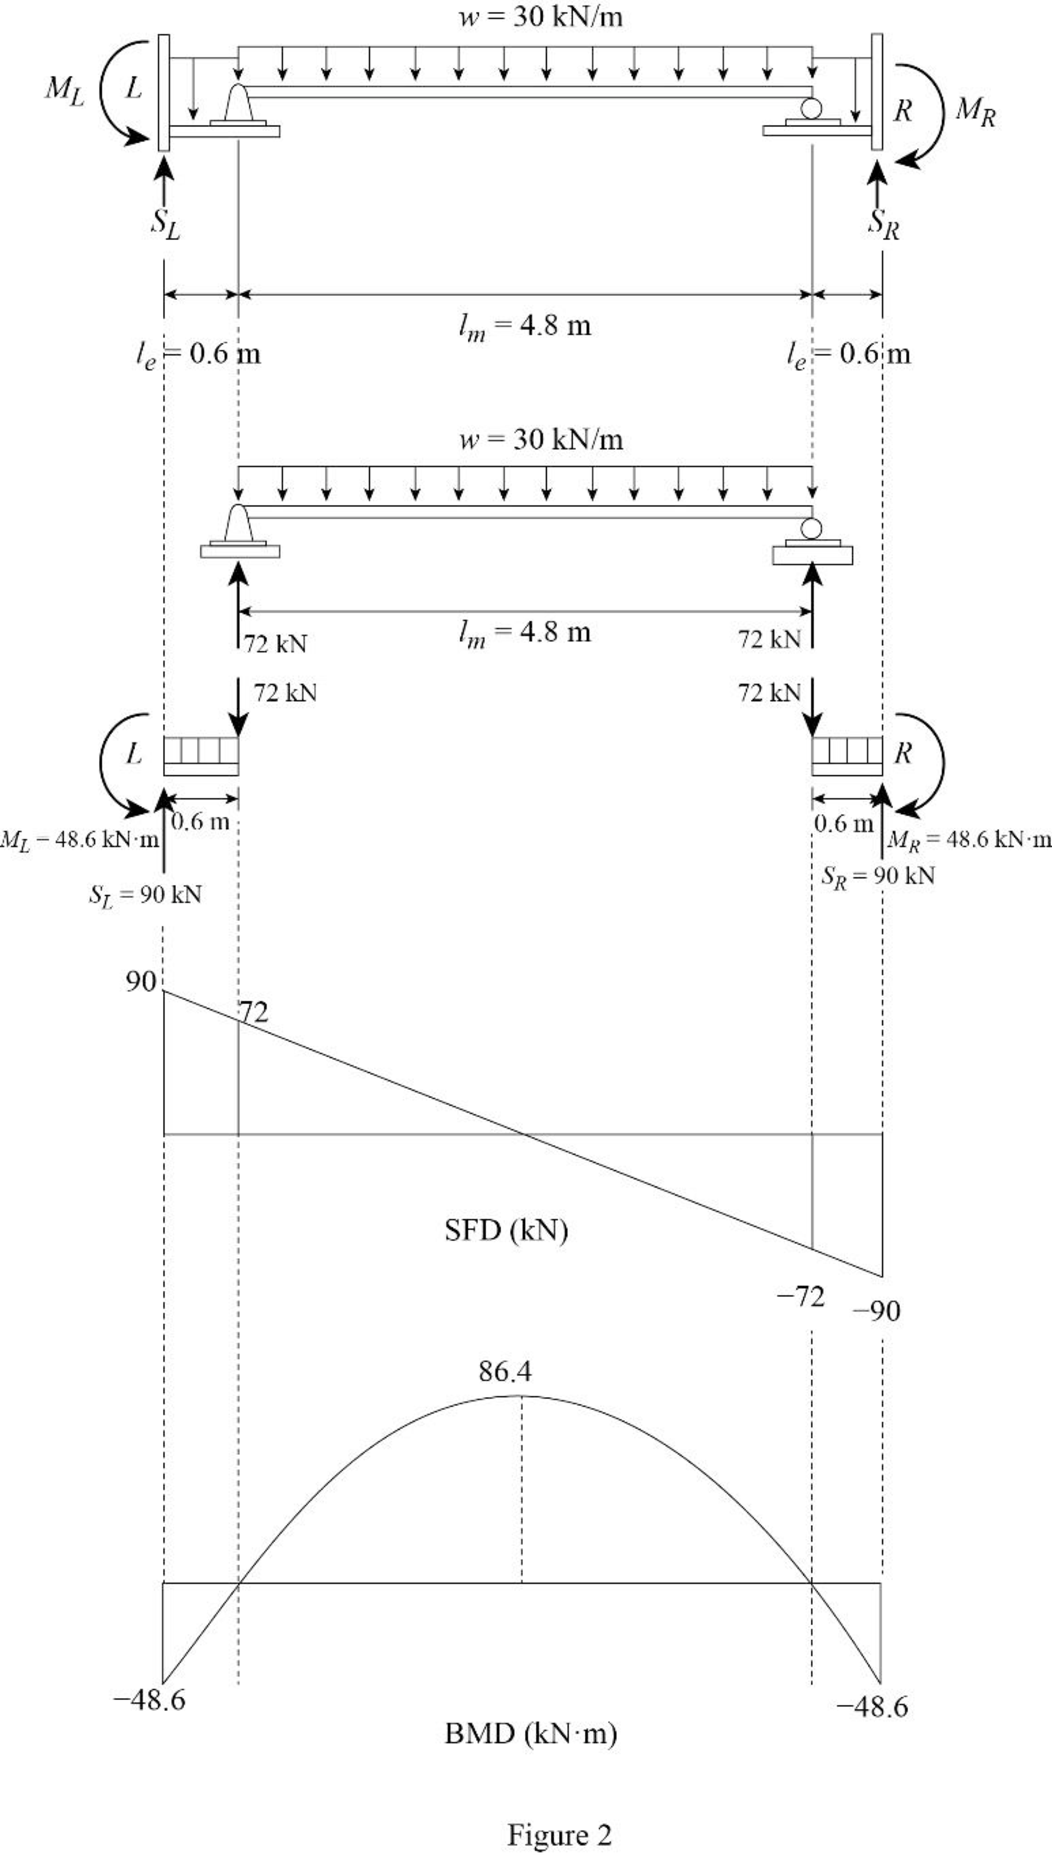
Determine the maximum bending moment at the middle of the girder using the relation.
Substitute 30 kN/m for w and 4.8 m for
Draw the shear force and bending moment diagram as in Figure (2).
Want to see more full solutions like this?
Chapter 12 Solutions
Structural Analysis, 5th Edition

- A traffic signal has a 60-second cycle length (Red time + Green time). For the travel direction of interest, the red and green times are 30 seconds each, the arrival rate is constant at 20 [veh/min] and the saturation flow (i.e., the departure rate) is 1 [veh/sec]. a. Calculate the average delay (for all vehicles) for the travel direction of interest. b. Assume a work zone on the street downstream of the intersection so that only 25 [veh/min] (in the direction of interest) can pass. Calculate the average delay caused by the work zone to a vehicle leaving the intersection. Assume that the queue at the work zone never backs- up into the intersection. c. Discuss qualitatively the implications of queue spillback from the work zone on the delay of the system. Traffic Direction (a) Traffic Direction (b)arrow_forwardAttached pics is a sample problem, can you compute it for me, I just want to compare my answer. Thank you.arrow_forwardProblem 2: The Douglas fir beam below supports uniform live (WL) and dead loads (WD) as shown below. Assume the total distributed load is 700 lb/ft. WD=300#/PT. W₁ = 400# W₁ = 400#/FT- J J J J I J J J L=161 a) Assuming an alllowable deflection of L/360, compute the magnitude of the allowable deflection. b) Using an 8"x12" timber beam (see Table A1-b on page 567 of your text for properties) compute the actual deflection. Assume E = 1.6 x 100 psi. c) Based on your answers for parts a and b, determine if an 8"x12" timber beam is safe for this applicationarrow_forward
- Please use relationship method as I do not understand that one.arrow_forwardA freeway study resulted in a speed-density relationship: v=60(1-0.008k). Determine: a. The free-flow speed. b. The jam density. c. The speed-flow relationship. d. The flow-density relationship. e. The critical density. f. The capacity.arrow_forwardAverage Shear Stress BASIC FORMULAS General Shear Stress fv lb Shear Flow Flexural or Bending Stress VQ q Fb Mc M 1 Sx dtw fy-shear stress V = shear capacity d depth of the section tw = web thickness Radius of Gyration Q-statical moment of area Imoment of inertia of whole section b value of width where you cut Note: can be used to solve maximum shear stress Note: Maximum Shear Stress is located at the neutral axis (smallest width) Section Modulus Sx=x NOTE: If not given Fy 248 MPa for A36 Steel Fu-400 MPa for A36 Steel Es-200,000 MPa fb flexural or bending stress M-moment capacity I-Moment of Inertia of the whole section Sx-section modulus fy actual shear stress (from loads) Fv allowable shear stress (from NSCP) fv-Fv; safe and economical Vmax= P2 P Mmax = COMMON LOADINGS AND SUPPORTS PPP L/4 4↓1 44 L/4 PL PL Ymax = 48E1 Vmax = 1.5P Mmax = 22 PL 19PL Ymax = 384E1 P P [[ P P WL Vmax= 2 Mmax = P P L/3 ↓ L/3 ↓ L/3 WL' Swi Ymax = 384 ΕΙ PL 23PL Vmax = P Mmax = 이 Ymax =. 648E1arrow_forward
- Consider, M people (aka pax) who want to travel by car from O to D. They all start working at D at Q (e.g., Q-8am). If a person departs at time t, assume the time needed to go from O to D is given by c(t)=A+Bx(t), where x(t) is the flow of people departing at time t [car/unit of time]. In addition, a is the penalty for being early at work (E(t) is how early the person arrived when departing at time t), and ẞ is the penalty for being late at work (L(t) is how late the person arrived when departing at time t). Assume 0 < a < 1 < ß. Further assume the departure time choice problem under the equilibrium conditions. Prove that the arrival time of people who depart when most of the M people start their trips is equal to Q.arrow_forwardConstruction Methodarrow_forwardConstruction Method Ps. not graded, just a reviewerarrow_forward
- If you could help me answer these questions in matlab that would be great, I provided an additional picture detailing what the outcome should look like.arrow_forwardA Water at A flows out of the 1-in.-diameter nozzle at 8 ft s and strikes the 0.5 -lb-plate.Determine the height h above the nozzle at which the plate can be supported by the water jetarrow_forward= = Q1/A cantilever sheet-pile wall penetrating a granular soil. Here, L₁= 3 m, L2 = 6 m, y 17.3kN/m³, Ysat 19.4 kN/m², and 0= 30. a. What is the theoretical depth of embedment, D? b. For a 30% increase in D, what should be the total length of the sheet piles? c. What should be the minimum section modulus of the sheet piles? Use σall = 172 MN/m².arrow_forward
