
Concept explainers
Videos
In addition to the key words, you should also be able to define each of the following terms:
Linear relationship
Pearson
Monotonic relationship
Spearman correlation
Statistical significance of a
Regression
Third-variable problem
Directionality problem
Multiple regression
To define:
Each of the following terms: Scatter plot, linear relationships, Pearson correlation, monotonic relationship, Spearman correlation, Statistical significance of a correlation, regression, third variable problem, directionality problem, multiple regressions.
Explanation of Solution
Explanations:
Scatter Plot: It is a 2D graph between 2 variables X and Y obtained by plotting X on horizontal and Y on vertical axes. The scatter plot is mainly done to study the extent of correlation between 2 variables. If a large correlation exists then the points scatter in a line and if there's no such correlation then they are scattered randomly.
Linear Relationship: In a linear relationship the relationship between 2 variables can be represented with a line. The linear relationship can be positive or negative depending on the fact that if X increase then Y increases too and it is positive. It is negative when X increases but Y decreases. Linear relationships can be determined using scatter plots between 2 variables. There ca be no relationship too in that case the points scattered randomly. Graphical representation of positive linear relation: 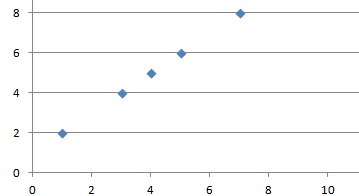
Pearson correlation:
Pearson product correlation coefficient is a measure of linear association between 2 variables X and Y. It has a value between -1 and +1 and is denoted by r.
r consists of a ratio comparing the covariance( X and Y) (numerator) with the variance of X and Y separately (in the denominator).
The formula:
Monotonic relationship: It is the degree to which the relationship is one directional. So as one value increases the other also increases and as one decreases other also decreases. Spearman correlation measures this value.
Spearman Correlation: This is distribution free alternative to Pearson r value. It measures strength and direction of monotonic relationship and used mostly for ordinal observations.
The formula is:
In this case ranks are calculated for each data X and Y and their difference is taken represented as d in the formula. It can also take values in (-1,+1)range. A high positive value like 0.9 indicates a strong positive correlation and vice versa. So here as X increases so does Y (Just like r).
Statistical Significance of a correlation: Correlation is tested using t statistic.
The formula is provided as
to test whether the linear relationship is strong enough to model the relationship in the population. The hypothesis tests decide if the population correlation
Regression: It is a set of statistical processes for establishing or estimating the relationship among variables. Regression analysis helps to understand how changes in independent variable results in changes in dependent variable. It is widely used for prediction and forecasting. It helps in understanding which independent variables are related to the dependent variable and what is the form of the relationship. In other words it can be used to establish causal relationship.
Third variable problem: In context of experimental design third variable can be confounded variable resulting in relationship between 2 variables. Example can be cities with higher churches have higher crime rate but more churches do not lead to more crime so a 3rd variable population lead to more churches and more crime.
Directionality problem: It's a problem with 2 variables when the cause and effect is not known. It's known that there exists a relationship between X and Y however whether X is due to Y or vice versa is not known. For that apart from correlational study experimental study are required to be conducted. So an example can be there's a strong correlation between amount of violence seen on Tv and amount of aggressive behavior by children but its not known whether amount of violence seen on TV is due to aggressive behavior or vice versa.
Multiple regressions: The general purpose of the multiple regressions is to establish a relationship between several predictor variables and a dependent variable. Notation ally if Y is a dependent variable and Xs are several predictors then f is a function or line of least square which is estimated in multiple regressions.
It is widely used in social and natural sciences. Educators might be interested in predictors for success in high school or psychologist might be interested in personality best predicting social adjustments.
For example Price of the house sold can be dependent variable and size of house, number of bedrooms, locality, average income in respective neighborhoods, and appeal of the house can be predictors. The other example can be Salary being dependent and amount of responsibility, number of people to supervise etc. are independent.
Want to see more full solutions like this?
Chapter 12 Solutions
Research Methods for the Behavioral Sciences (MindTap Course List)


- Should you be confident in applying your regression equation to estimate the heart rate of a python at 35°C? Why or why not?arrow_forwardGiven your fitted regression line, what would be the residual for snake #5 (10 C)?arrow_forwardCalculate the 95% confidence interval around your estimate of r using Fisher’s z-transformation. In your final answer, make sure to back-transform to the original units.arrow_forward
- BUSINESS DISCUSSarrow_forwardA researcher wishes to estimate, with 90% confidence, the population proportion of adults who support labeling legislation for genetically modified organisms (GMOs). Her estimate must be accurate within 4% of the true proportion. (a) No preliminary estimate is available. Find the minimum sample size needed. (b) Find the minimum sample size needed, using a prior study that found that 65% of the respondents said they support labeling legislation for GMOs. (c) Compare the results from parts (a) and (b). ... (a) What is the minimum sample size needed assuming that no prior information is available? n = (Round up to the nearest whole number as needed.)arrow_forwardThe table available below shows the costs per mile (in cents) for a sample of automobiles. At a = 0.05, can you conclude that at least one mean cost per mile is different from the others? Click on the icon to view the data table. Let Hss, HMS, HLS, Hsuv and Hмy represent the mean costs per mile for small sedans, medium sedans, large sedans, SUV 4WDs, and minivans respectively. What are the hypotheses for this test? OA. Ho: Not all the means are equal. Ha Hss HMS HLS HSUV HMV B. Ho Hss HMS HLS HSUV = μMV Ha: Hss *HMS *HLS*HSUV * HMV C. Ho Hss HMS HLS HSUV =μMV = = H: Not all the means are equal. D. Ho Hss HMS HLS HSUV HMV Ha Hss HMS HLS =HSUV = HMVarrow_forward
 Glencoe Algebra 1, Student Edition, 9780079039897...AlgebraISBN:9780079039897Author:CarterPublisher:McGraw Hill
 Big Ideas Math A Bridge To Success Algebra 1: Stu...AlgebraISBN:9781680331141Author:HOUGHTON MIFFLIN HARCOURTPublisher:Houghton Mifflin Harcourt
 College AlgebraAlgebraISBN:9781305115545Author:James Stewart, Lothar Redlin, Saleem WatsonPublisher:Cengage Learning
 Algebra and Trigonometry (MindTap Course List)AlgebraISBN:9781305071742Author:James Stewart, Lothar Redlin, Saleem WatsonPublisher:Cengage Learning
 Holt Mcdougal Larson Pre-algebra: Student Edition...AlgebraISBN:9780547587776Author:HOLT MCDOUGALPublisher:HOLT MCDOUGAL
 Functions and Change: A Modeling Approach to Coll...AlgebraISBN:9781337111348Author:Bruce Crauder, Benny Evans, Alan NoellPublisher:Cengage Learning