
Downward sloping of aggregate demand curve.
Explanation of Solution
The aggregate demand (AD) curve shows an inverse relation between
The aggregate demand curve slopes downward due to three reasons:
Real balance effect: A change in the price level produces the real balance effect. A rise in the price level, results in a decrease in the
Interest Rate Effect: Assuming the money supply in the economy to be fixed, rise in price level implies more money required for purchases and pay for inputs. So, an increase in money demanded would increase the price paid for it, that is. the interest rate. The rise in interest rate will increase the borrowing costs which decrease the investment expenditure. This will decrease the quantity of real output demanded, thus decreasing the aggregate demand.
Foreign Purchases Effect: It is one of the key reasons behind the sloping of the aggregate demand curve. When the domestic price level rises relative to foreign price levels, foreigners buy fewer domestic goods as it becomes more expensive and people (domestic) opt for more foreign goods. Therefore, the export of domestic goods decline and import of foreign goods rise. As a result, there will be a decline in the overall demand for our domestic output. Thus the aggregate quantity demanded of GDP will decline. This slopes the AD curve downwards.
The reasons for downward sloping of AD curve are different from the reason for downward sloping of demand curve of a single-product. Assuming, a constant money income, substitution effect can work on a single product, whereby dropping prices of a single product make it relatively cheaper product compared to the other products whose price have not been changed. Also, the consumer has become richer in real terms, as he could afford more of the product whose price has been declined. But with the AD curve, as all the prices are falling implies dropping of the price level, thus single product substitution effect is not applicable in AD curve. Also, while dealing with demand of a single product, money income is assumed to be fixed. But this assumption is not applicable in case of AD curve because with regard to the circular flow of the economy, lower prices indicate lower incomes. Thus a decline in the price level does not necessarily imply an increase in the nominal income of the economy as a whole since as prices are dropping, so are the receipts or revenue of the sellers.
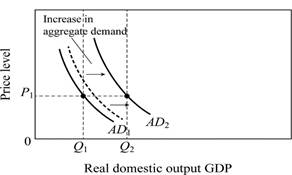
Figure-1
The multiplier effect acts on the initial change in spending to generate an even greater shift in the aggregate demand curve.
For instance, Figure 1 shows how multiplier effect works on an increase in income expenditure. The initial increase in spending is reflected by the broken line of AD curve, and then multiplier effect shift the AD curve from AD1 to AD2.
Concept Introduction:
Aggregate Demand: It refers to the total value of the goods and services available for purchase at a particular price in a given period of time.
Multiplier effect: Multiplier refers to the ratio of change in the real GDP to the change in initial consumption at constant price rate. Multiplier is positively related to the marginal propensity to consumer and negatively related with the marginal propensity to save.
Want to see more full solutions like this?
Chapter 12 Solutions
Macroeconomics: Principles, Problems, & Policies

- Critically analyse the five (5) characteristics of Ubuntu and provide examples of how they apply to the National Health Insurance (NHI) in South Africa.arrow_forwardCritically analyse the five (5) characteristics of Ubuntu and provide examples of how they apply to the National Health Insurance (NHI) in South Africa.arrow_forwardOutline the nine (9) consumer rights as specified in the Consumer Rights Act in South Africa.arrow_forward
- In what ways could you show the attractiveness of Philippines in the form of videos/campaigns to foreign investors? Cite 10 examples.arrow_forwardExplain the following terms and provide an example for each term: • Corruption • Fraud • Briberyarrow_forwardIn what ways could you show the attractiveness of a country in the form of videos/campaigns?arrow_forward
 Essentials of Economics (MindTap Course List)EconomicsISBN:9781337091992Author:N. Gregory MankiwPublisher:Cengage Learning
 Brief Principles of Macroeconomics (MindTap Cours...EconomicsISBN:9781337091985Author:N. Gregory MankiwPublisher:Cengage Learning
 Exploring EconomicsEconomicsISBN:9781544336329Author:Robert L. SextonPublisher:SAGE Publications, Inc
 Macroeconomics: Principles and Policy (MindTap Co...EconomicsISBN:9781305280601Author:William J. Baumol, Alan S. BlinderPublisher:Cengage Learning