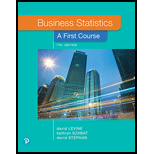
Pearson eText Business Statistics: First Course -- Instant Access (Pearson+)
8th Edition
ISBN: 9780136880974
Author: David Levine, David Stephan
Publisher: PEARSON+
expand_more
expand_more
Solutions are available for other sections.
Question
error_outline
This textbook solution is under construction.
Students have asked these similar questions
Give correct answer this financial accounting question
Need help with this general accounting question
PLEASE HELP ME WITH THIS
Knowledge Booster
Similar questions
- This is an individual assignment. You are required to create a formal topic-to-sentence outline and a full five-paragraph essay [containing an introductory paragraph, 3 body paragraphs and a concluding paragraph], followed by an appropriate Works Cited list, and an annotated bibliography of one source used in the essay. Your essay must be based on ONE of the following prompts. EITHER A. What are the qualities of a socially responsible individual? OR B. Discuss three main groupings of life skills required by Twenty-first Century employers. Additionally, you will state which one of the expository methods [Analysis by Division OR Classification] you chose to guide development of your response to the question selected, and then provide a two or three sentence justification of that chosen method. Your essay SHOULD NOT BE LESS THAN 500 words and SHOULD NOT EXCEED 700 words. You are required to use three or four scholarly / reliable sources of evidence to support the claims made in your…arrow_forwardWhat is the gross profit rate on these general accounting question?arrow_forwardProvide answer this following requirements on these financial accounting questionarrow_forward
- PLEASE DO THE LAST ROW!!arrow_forwardFILL ALL CELLS PLEASE HELParrow_forwardLuctor Actual overhead costs Actual qty of the allocation base used Estimated overhead costs Estimated qty of the allocation base Predetermined OH allocation rate Data table Activity Allocation Base Supplies Number of square feet Travel Number of customer sites Allocation Rate $0.07 per square foot $23.00 per site Print Done Clear all Check answer 12:58 PMarrow_forward
- Were the overheads over applied or under applied and by how much for this general accounting question?arrow_forwardThe Trainer Tire Company provided the following partial trial balance for the current year ended December 31. The company is subject to a 45% income tax rate.arrow_forwardProvide correct answer this general accounting questionarrow_forward
- Needam Company has analyzed its production process and identified two primary activities. These activities, their allocation bases, and their estimated costs are listed below. BEE (Click on the icon to view the estimated costs data.) The company manufactures two products: Regular and Super. The products use the following resources in March: BEE (Click on the icon to view the actual data for March.) Read the requirements. Requirement 5. Compute the predetermined overhead allocation rates using activity-based costing. Begin by selecting the formula to calculate the predetermined overhead (OH) allocation rate. Then enter the amounts to compute the all Actual overhead costs Actual qty of the allocation base used Estimated overhead costs Estimated qty of the allocation base Predetermined OH allocation rate Data table Data table Regular Super Number of purchase orders 10 purchase orders Number of parts 600 parts 13 purchase orders 800 parts Activity Purchasing Materials handling - X…arrow_forwardMakenna is a waiter at Albicious Foods in South Carolina. Makenna is single with one other dependent and receives the standard tipped hourly wage. During the week ending October 25, 2024, Makenna worked 44 hours and received $210 in tips. Calculate Makenna's gross pay, assuming tips are included in the overtime rate determination. Use Table 3-2. Required: 1. Complete the payroll register for Makenna. 2a. Does Albicious Foods need to contribute to Makenna’s wages to meet FLSA requirements? 2b. If so, how much should be contributed?arrow_forward10. Record the journal entries for Holley Company for August. 11. Post appropriate entries to the Conversion Costs T-account to determine the amount of underallocated or overallocated overhead. Record the adjusting entry. 10. Record the journal entries for Holley Company for August. (Record debits first, then credits. Exclude explanations from journal entries) Journalize the purchase of raw materials. Date 5 a. Accounts Debit Credit Accounts Payable Accounts Receivable Conversion Costs Cost of Goods Sold Finished Goods Inventory Raw and In-Process Inventory Sales Revenue Wages Payable, Accumulated Depreciation, etc. More info a. Purchased raw materials on account, $30,000. b Incurred labor and overhead costs, $65,000. C d. Completed 900 units with standard costs of $75 for direct materials and $180 for conversion costs. Sold on account 600 units for $400 each. Print Done - Xarrow_forward
arrow_back_ios
SEE MORE QUESTIONS
arrow_forward_ios
Recommended textbooks for you

 AccountingAccountingISBN:9781337272094Author:WARREN, Carl S., Reeve, James M., Duchac, Jonathan E.Publisher:Cengage Learning,
 Accounting Information SystemsAccountingISBN:9781337619202Author:Hall, James A.Publisher:Cengage Learning,
 Horngren's Cost Accounting: A Managerial Emphasis...AccountingISBN:9780134475585Author:Srikant M. Datar, Madhav V. RajanPublisher:PEARSON
 Intermediate AccountingAccountingISBN:9781259722660Author:J. David Spiceland, Mark W. Nelson, Wayne M ThomasPublisher:McGraw-Hill Education
 Financial and Managerial AccountingAccountingISBN:9781259726705Author:John J Wild, Ken W. Shaw, Barbara Chiappetta Fundamental Accounting PrinciplesPublisher:McGraw-Hill Education


Accounting
Accounting
ISBN:9781337272094
Author:WARREN, Carl S., Reeve, James M., Duchac, Jonathan E.
Publisher:Cengage Learning,

Accounting Information Systems
Accounting
ISBN:9781337619202
Author:Hall, James A.
Publisher:Cengage Learning,

Horngren's Cost Accounting: A Managerial Emphasis...
Accounting
ISBN:9780134475585
Author:Srikant M. Datar, Madhav V. Rajan
Publisher:PEARSON

Intermediate Accounting
Accounting
ISBN:9781259722660
Author:J. David Spiceland, Mark W. Nelson, Wayne M Thomas
Publisher:McGraw-Hill Education

Financial and Managerial Accounting
Accounting
ISBN:9781259726705
Author:John J Wild, Ken W. Shaw, Barbara Chiappetta Fundamental Accounting Principles
Publisher:McGraw-Hill Education