
The effect of changes in
Explanation of Solution
The effect of changes in price of oil along with subsidy on the price of corn is depicted in Figure 1 using the
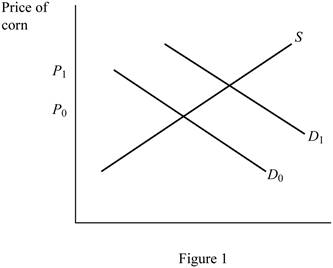
In Figure 1, the horizontal axis represents the quantity of corn, whereas the vertical axis denotes the price of corn.
The effect of changes in price of oil along with subsidy on the price of farmland is depicted in Figure 2 using the demand and supply model.
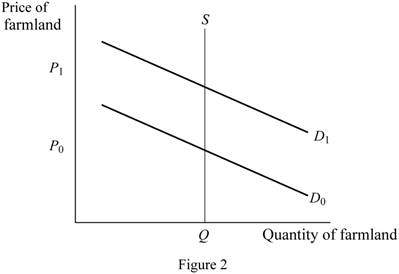
In Figure 2, the horizontal axis represents the quantity of farmland, whereas the vertical axis denotes the price of farmland.
The effect of changes in price of oil along with subsidy on the price of other agricultural products such as wheat is depicted in Figure 3 using the demand and supply model.
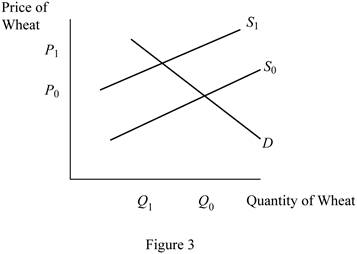
In Figure 3, the horizontal axis represents the quantity of wheat, whereas the vertical axis denotes the price of wheat.
When the oil prices increase simultaneously with the rolling out of subsidy in ethanol production, the demand for ethanol will increase. As the demand for ethanol increases, the demand for corn used for its production also increases. This shifts the demand curve of corn to the right from D0 to D1 as in Figure 1. This increases the price of the corn.
As a result of it, the market value of farmland will increase due to the increase in demand for land as depicted in Figure 2 causing the rightward shift of the demand for land from D0 to D1 as in figure 2.
From now, more of the farmland would be devoted to the production of corn; less of it would be available for the production of other agricultural products such as wheat. This implies that the supply of wheat would decrease causing a leftward shift of the supply curve from S0 to S1 as in Figure 3, thereby increasing the price of wheat.
When the oil prices decreases, the demand for ethanol will decrease. As the demand for ethanol decreases, the demand for corn used for its production also decreases. This shifts the demand curve of corn to the left from D1 to D0 as in Figure 1. This decreases the price of the corn.
As a result of it, the market value of farmland will decrease due to the decrease in demand for land for corn production as depicted in Figure 2 causing the leftward shift of the demand for land from D1 to D0 as in Figure 2. This decreases the price of the farmland.
From now, less of the farmland would be devoted to the production of corn; more of it would be available for the production of other agricultural products such as wheat. This implies that the supply of wheat would increase causing a rightward shift of the supply curve from S1 to S0 as in figure 3, thereby decreasing the price of wheat.
Demand: Demand is the quantity of goods and services that people are willing and able to buy at different prices in a given period of time.
Supply: Supply is the quantity of goods and services that people are willing to sell at different prices in a given period of time.
Want to see more full solutions like this?
Chapter 12 Solutions
EBK PRINCIPLES OF MICROECONOMICS

- Critically analyse the five (5) characteristics of Ubuntu and provide examples of how they apply to the National Health Insurance (NHI) in South Africa.arrow_forwardCritically analyse the five (5) characteristics of Ubuntu and provide examples of how they apply to the National Health Insurance (NHI) in South Africa.arrow_forwardOutline the nine (9) consumer rights as specified in the Consumer Rights Act in South Africa.arrow_forward
- In what ways could you show the attractiveness of Philippines in the form of videos/campaigns to foreign investors? Cite 10 examples.arrow_forwardExplain the following terms and provide an example for each term: • Corruption • Fraud • Briberyarrow_forwardIn what ways could you show the attractiveness of a country in the form of videos/campaigns?arrow_forward

 Principles of Economics (12th Edition)EconomicsISBN:9780134078779Author:Karl E. Case, Ray C. Fair, Sharon E. OsterPublisher:PEARSON
 Engineering Economy (17th Edition)EconomicsISBN:9780134870069Author:William G. Sullivan, Elin M. Wicks, C. Patrick KoellingPublisher:PEARSON
 Principles of Economics (MindTap Course List)EconomicsISBN:9781305585126Author:N. Gregory MankiwPublisher:Cengage Learning
 Managerial Economics: A Problem Solving ApproachEconomicsISBN:9781337106665Author:Luke M. Froeb, Brian T. McCann, Michael R. Ward, Mike ShorPublisher:Cengage Learning
 Managerial Economics & Business Strategy (Mcgraw-...EconomicsISBN:9781259290619Author:Michael Baye, Jeff PrincePublisher:McGraw-Hill Education